
Trending

What You Need to Know
In a world of macroeconomic and market uncertainty, the fear of losing money may deter investors from seeking to capture equity return potential. Is there a way to stay confident when volatility strikes? Equity strategies that target downside risk reduction can help. By seeking to reduce losses in downturns, these portfolios have less ground to regain when the market recovers. Our Low Volatility Equities team shows how over time, this gentler return pattern can deliver surprisingly resilient returns, helping investors stay in the market through bouts of turbulence.
VIEW WHITE PAPER
It’s a deeply ingrained investing maxim that risk and return go hand in hand: to get more return, you must accept more risk. So some investors may find it counterintuitive that the opposite is also true: you can take less risk and still beat the market over time. It’s a different way of defining investment success that leans on downside defenses in the pursuit of long-term goals.
Meeting investment objectives today requires a fresh mind-set. Investors have been facing an uncertain future of structurally higher inflation and interest rates since last year, when an increase in volatility rattled markets. Macroeconomic uncertainty often creates unstable market conditions that may deter investors from taking more risk to capture return potential.
That creates a troubling conundrum for many investors. Whether an individual saving for retirement, a pension plan facing funding gaps or an insurance company dealing with stiffer capital requirements and asset/liability-matching challenges, investors can’t tolerate wild market swings, let alone the prospect of losing money. They need their investments to go the distance.
Strategies that expressly target downside-risk reduction can address many of these needs. These solutions get their performance power from the simple mathematics of lower risk drag and compounding. Stocks that lose less in market downturns have less ground to regain when the market recovers, so they’re better positioned to compound off those higher returns in subsequent rallies. Over time, this gentler return pattern can end up ahead of the market.
A measure known as upside/downside capture helps explain how preserving capital in the near term can actually drive outperformance over the long term. Imagine a hypothetical global stock portfolio that captured 90% of every market rally and fell only 70% as much as the market during every sell-off. What would the long-term returns of this portfolio look like?
You might think it would underperform; it wouldn’t. As the display below illustrates, $100 invested in this portfolio in 1986 would have built up more than $4,541 in capital through 2022 and delivered a smoother ride through the ups and downs of the market. That’s approximately 2.8 times more capital than that generated by the MSCI World Index.
It’s not easy to build a portfolio that can capture more upside during market rallies than it loses during downturns over time. In this paper, we explain why the secret to delivering on the 90%/70% potential lies in finding high-quality stocks with stable trading patterns and attractive prices (QSP). It also requires the ability to nimbly adjust exposures as insights into fundamental attractiveness and risks change.
Display 1: How Investors Can Reduce Losses in Downturns and Still Beat the Market
Growth of $100
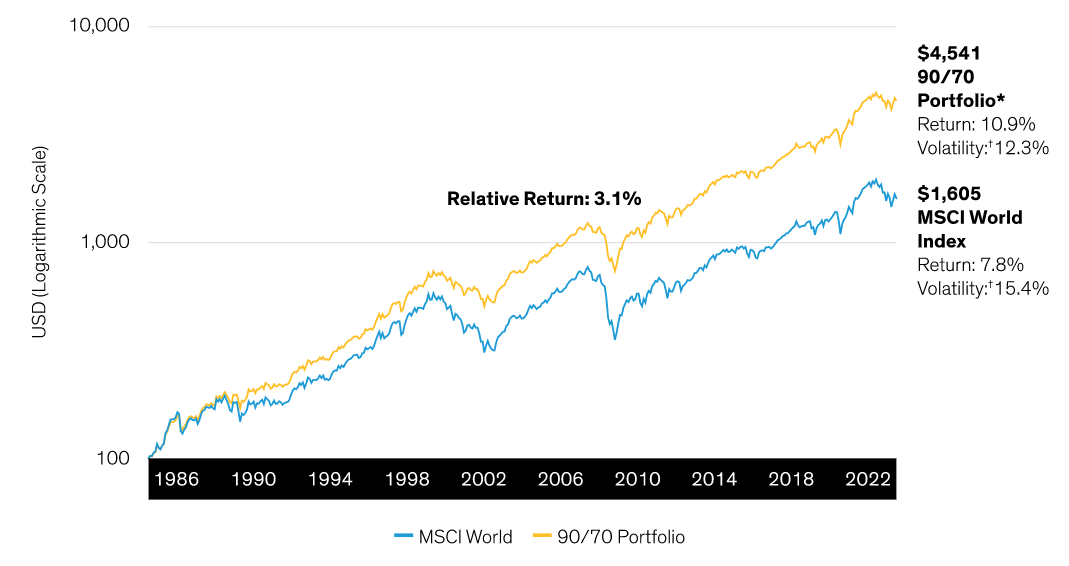
Past performance does not guarantee future results. Returns shown are for illustrative purposes only and are not representative of any AB fund. It is not possible to invest in an index.
*Performance calculated by multiplying all positive monthly returns (0% or greater) of the MSCI World Index by 90% and all negative returns (less than 0%) by 70%; shown in logarithmic scale
†Annualized standard deviation
Data from March 31, 1986 (inception date of MSCI World Index) through December 31, 2022
As of December 31, 2022
Source: MSCI and AllianceBernstein (AB)
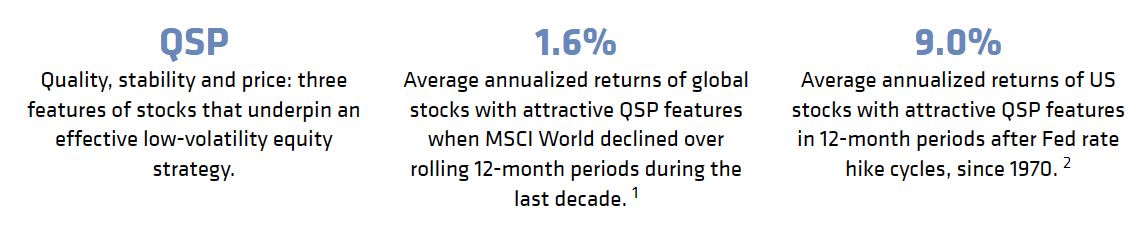
1 QSP returns are for the quintile of stocks with the highest Strategic Core Edge. Strategic Core Edge is the expected return from a proprietary model combining a number of quality, stability and price factors, with a ratio of approximately one-third for each quality, stability and price component.
2 Average forward 12-month equally weighted USD returns of QSP stocks with a first-quintile AB QSP score at the start of each month, relative to the equally weighted returns of the universe. The AB QSP score is calculated as follows: [(1/3) Quality {return on assets z score} + (1/3) Stability {-AB adaptive beta z score} + (1/3) Price {earnings/price z score}]. Universe is the Russell 1000 (since its inception of January 1, 1984) and the largest 1,000 US stocks in the AB research universe prior to the Russell 1000 inception.
Past performance, historical and current analyses, and expectations do not guarantee future results.
The views expressed herein do not constitute research, investment advice or trade recommendations and do not necessarily represent the views of all AB portfolio-management teams and are subject to revision over time.
Related: Learnings From Earnings: Macro Crosscurrents Make Growth Elusive