
Trending

Investors watch CNBC and CNBC’s competitors for guidance on where the markets are going. CNBC may provide insightful commentary from very qualified investors. Still, if one is watching CNBC to figure out where markets are headed, they may be better served to turn off the TV and look to the bond market for direction.
Today, real yields, or the bond yield less inflation expectations, helps explain the movement of many assets. If we are to form reasonable expectations for stocks, commodities, the dollar index, and gold prices, we best have an opinion on where real yields are going.
In this article, we share evidence supporting the recent strong relationship between real yields and risk assets. We then ponder where real yields are heading to help save you the confusion of trying to follow the conflicting bullish and bearish views presented on CNBC.
What Are Real Yields
The real yield is the yield an investor expects to receive after inflation. Think of it as the amount of purchasing power a bondholder expects to gain or lose. The inflation figure within the calculation is based on inflation expectations which are a byproduct of the difference between TIP yields and nominal yields.
In a free market, lenders should be compensated for lending money. The compensation in the form of interest rate should encompass the risk of non-repayment, the opportunity cost of not having the money available, and expected inflation.
The focus of this article is primarily inflation, but risk and opportunity costs are also high.
What Do Real Yields Tell Us?
The graph below charts real five-year Treasury yields since 2005. The current real yield is 1.62%, the highest level since 2009. Since January 1, 2022, the real yield has risen 3.2% (from -1.58% to +1.62%). The composition of the change is important. Since the start of the year, inflation expectations have fallen by .55%, while nominal bond yields are 2.65% higher.
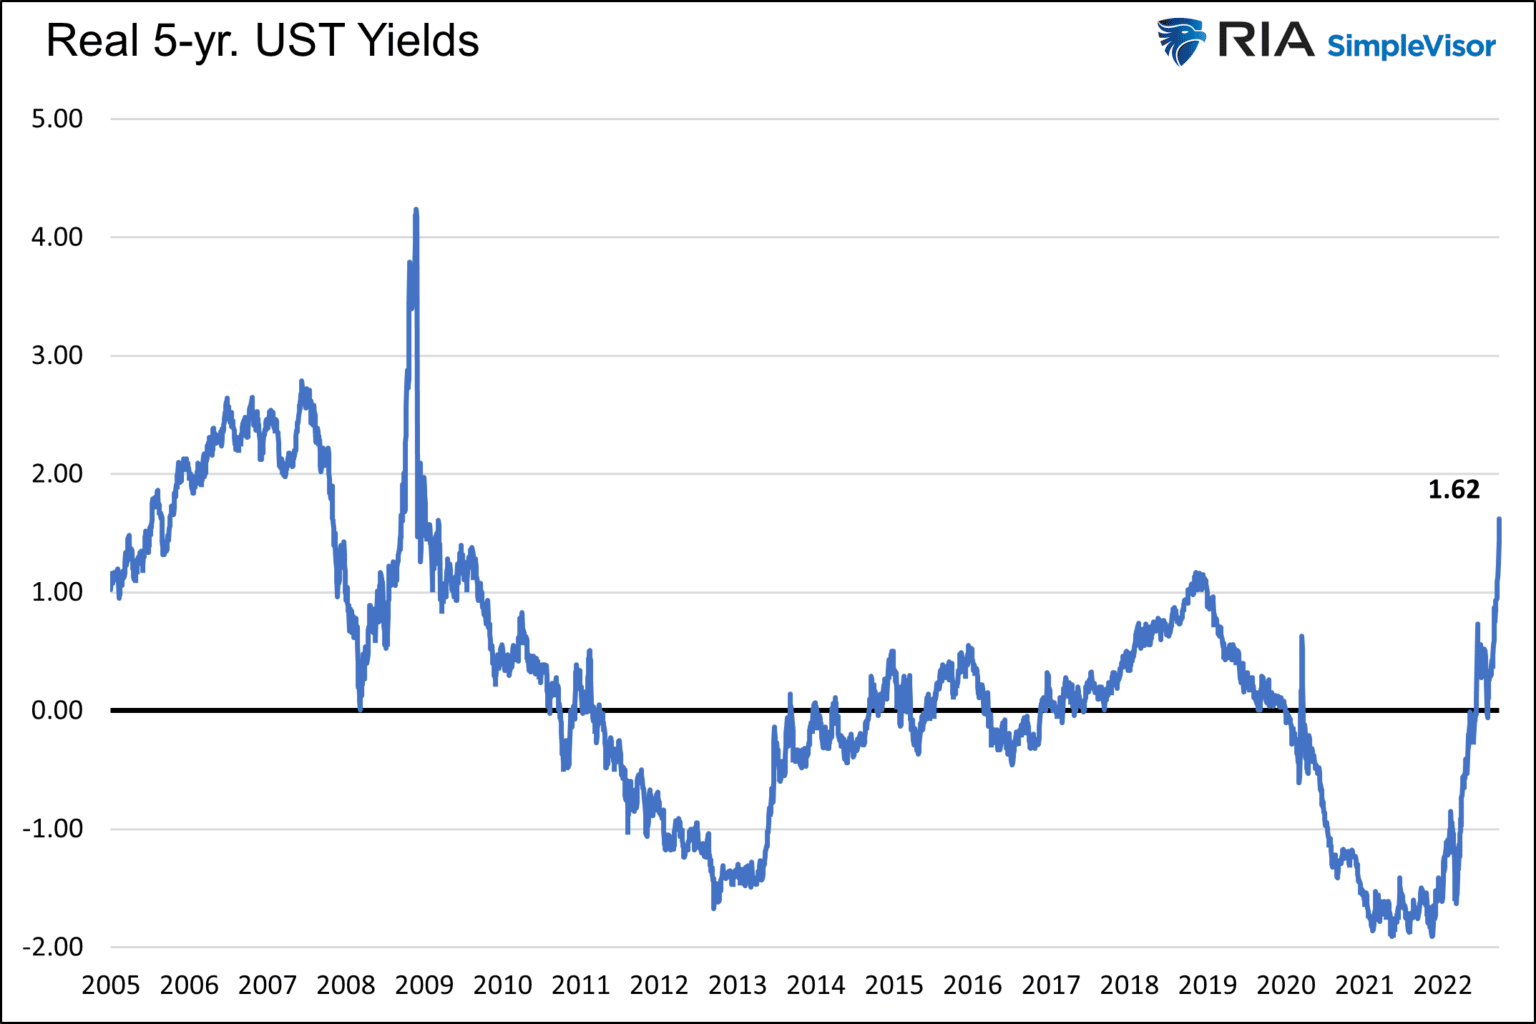
The level of real interest rates is a sturdy gauge of the weight of Federal Reserve policy. If the Fed is treading lightly and not distorting markets, real rates should be slightly positive. The more the Fed manipulates markets from their natural rates, the more negative real rates become. –The Fed’s Ever-Growing Golden Footprint
Risk Assets vs. Real Yields
Before sharing our expectations for where real yields might be in the future, it is worth showing the recent strong relationship between real yields and risk assets.
Stocks
Fed actions to halt inflation, including hiking interest rates and QT, reduce liquidity in the financial markets and economy. Accordingly, they are not beneficial for stock prices. When considering allocations to stocks, what matters is the degree to which they apply monetary policy.
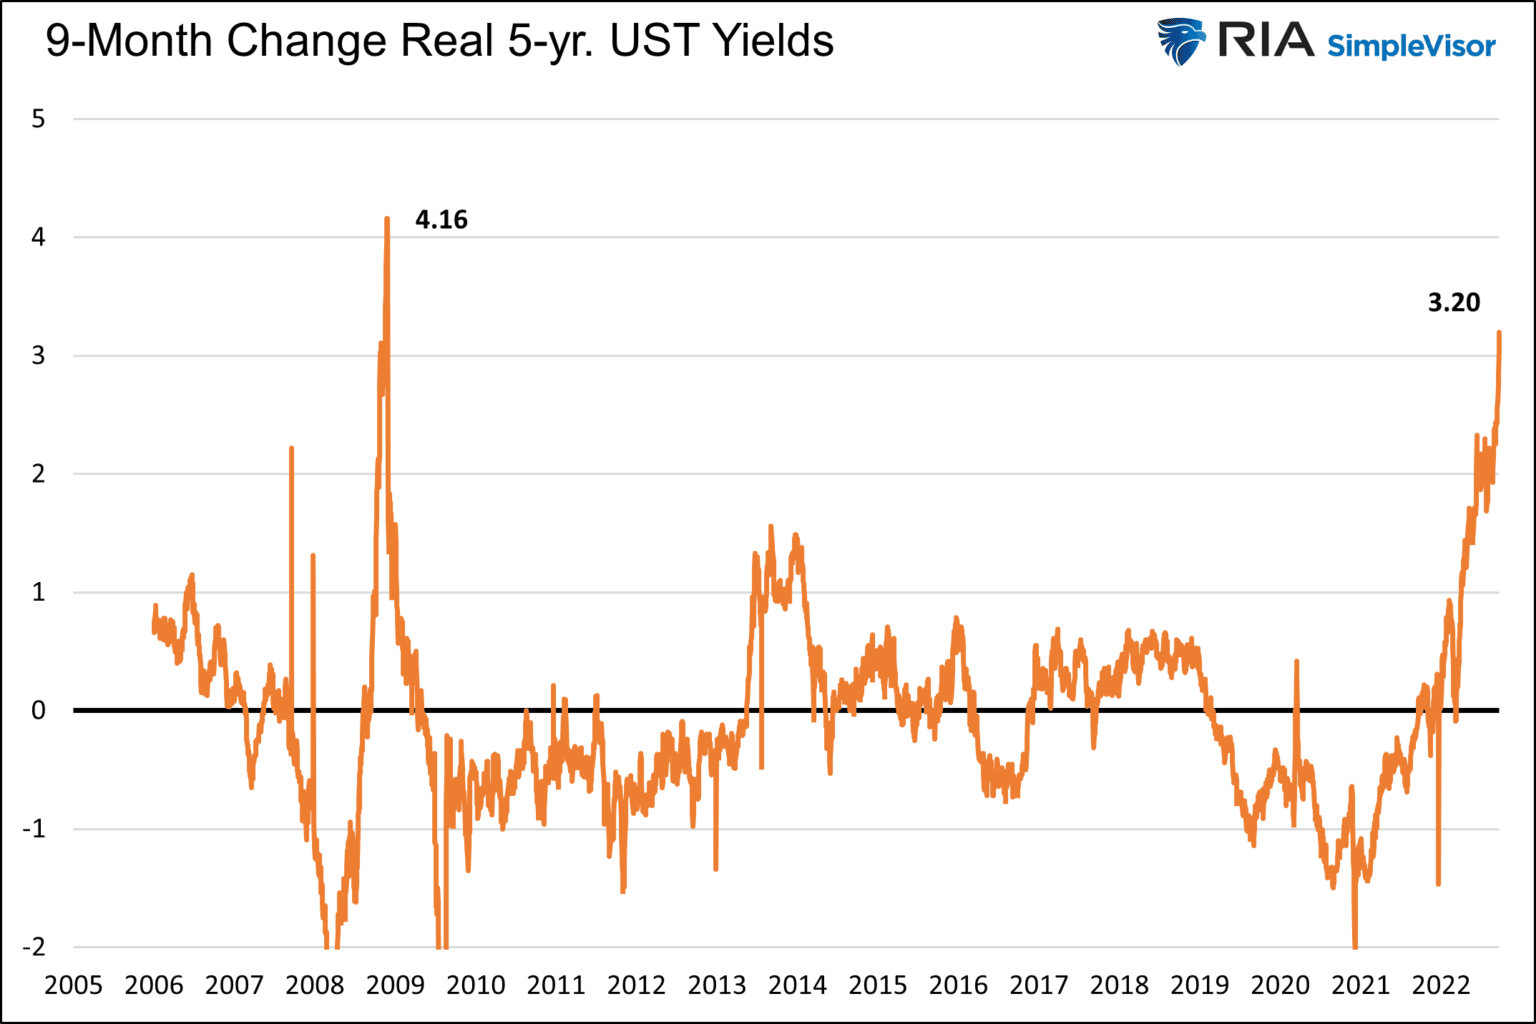
The graph below shows that the recent increase in real yields is like the sharp jump in October 2008. At that time, the financial system failed, and the Fed introduced QE. In a matter of months, inflation expectations whipsawed from +2.70% to -2.40% and back to zero percent. Nominal yields fell sharply over the period.
Today’s increase in real yields is due primarily to increasing nominal yields and less so inflation expectations. Accordingly, the increase in real yields will be much more damaging to the economy than the last time real yields were at similar levels.
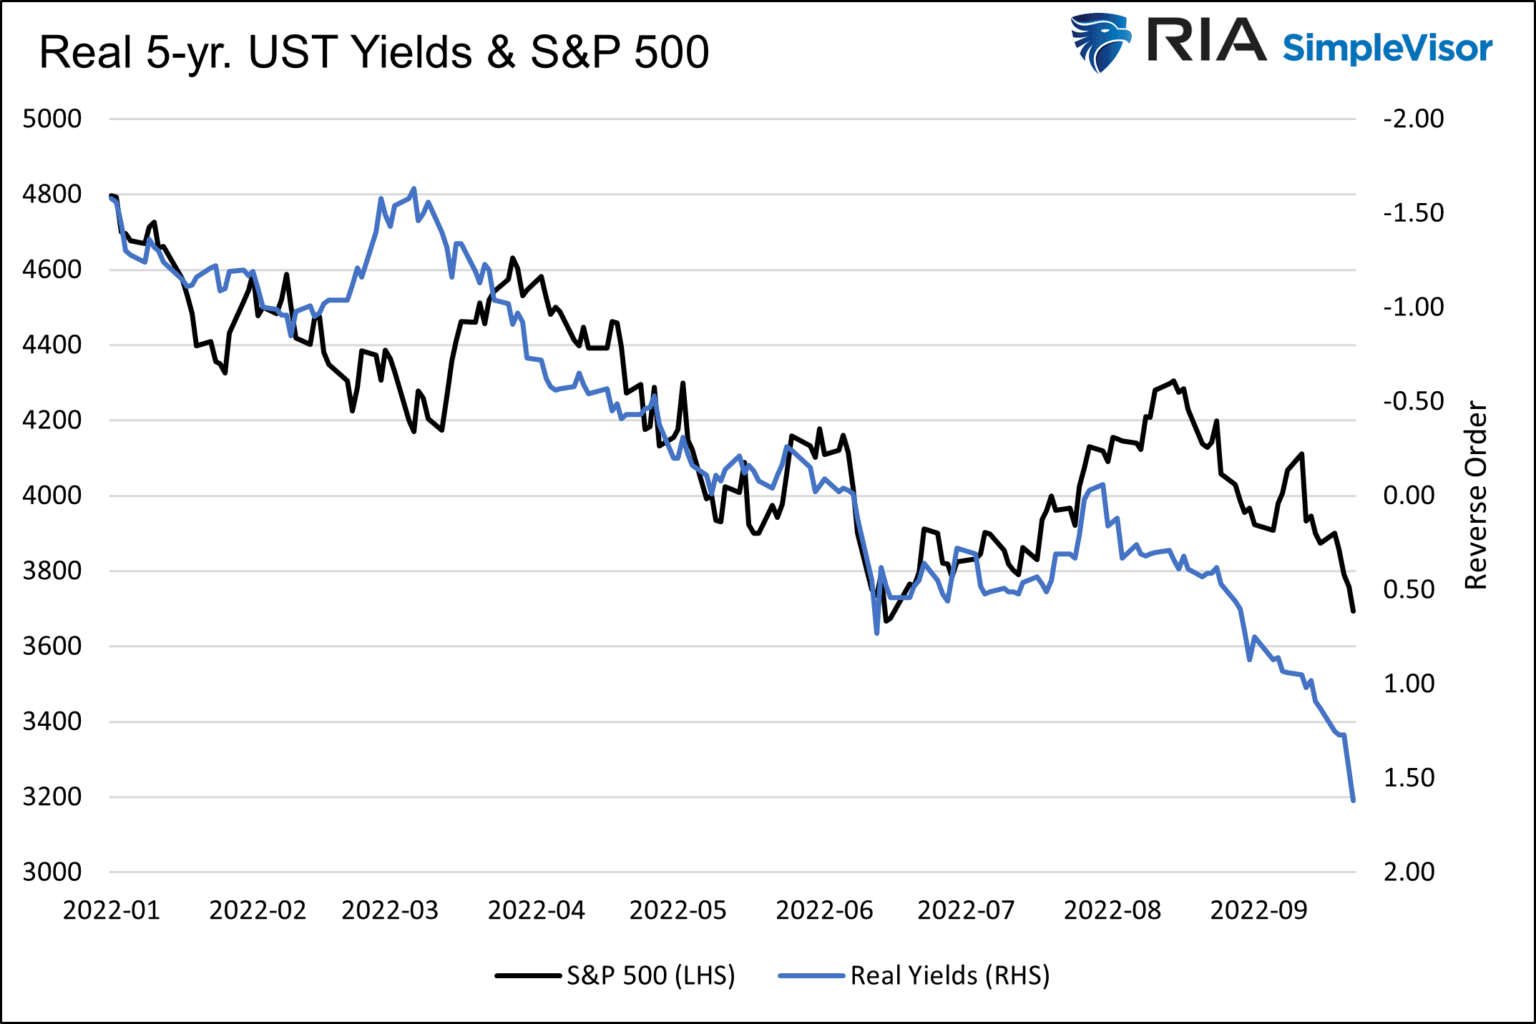
The following graph shows the strong inverse correlation between real yields and stock prices this year. The Y-axis of the chart pertaining to real yields is in reverse order to highlight the relationship better. The Fed is aggressively removing liquidity, and not surprisingly, stocks are heading lower.
Dollar
The U.S. dollar has surged this year against all currencies. Recently the linkage between dollar strength and bond weakness has been pronounced.
The graph below shows the strong correlation between the dollar and real yields this year. The Fed is employing the most aggressive hawkish monetary policy among developed nations. Such policy should keep the dollar well bid, barring central banks intervening in the FX markets.

Commodities
Commodity prices and the dollar tend to be negatively correlated as most global trade in commodities occurs in U.S. dollars. When the dollar is strong, commodity prices tend to weaken and vice versa.
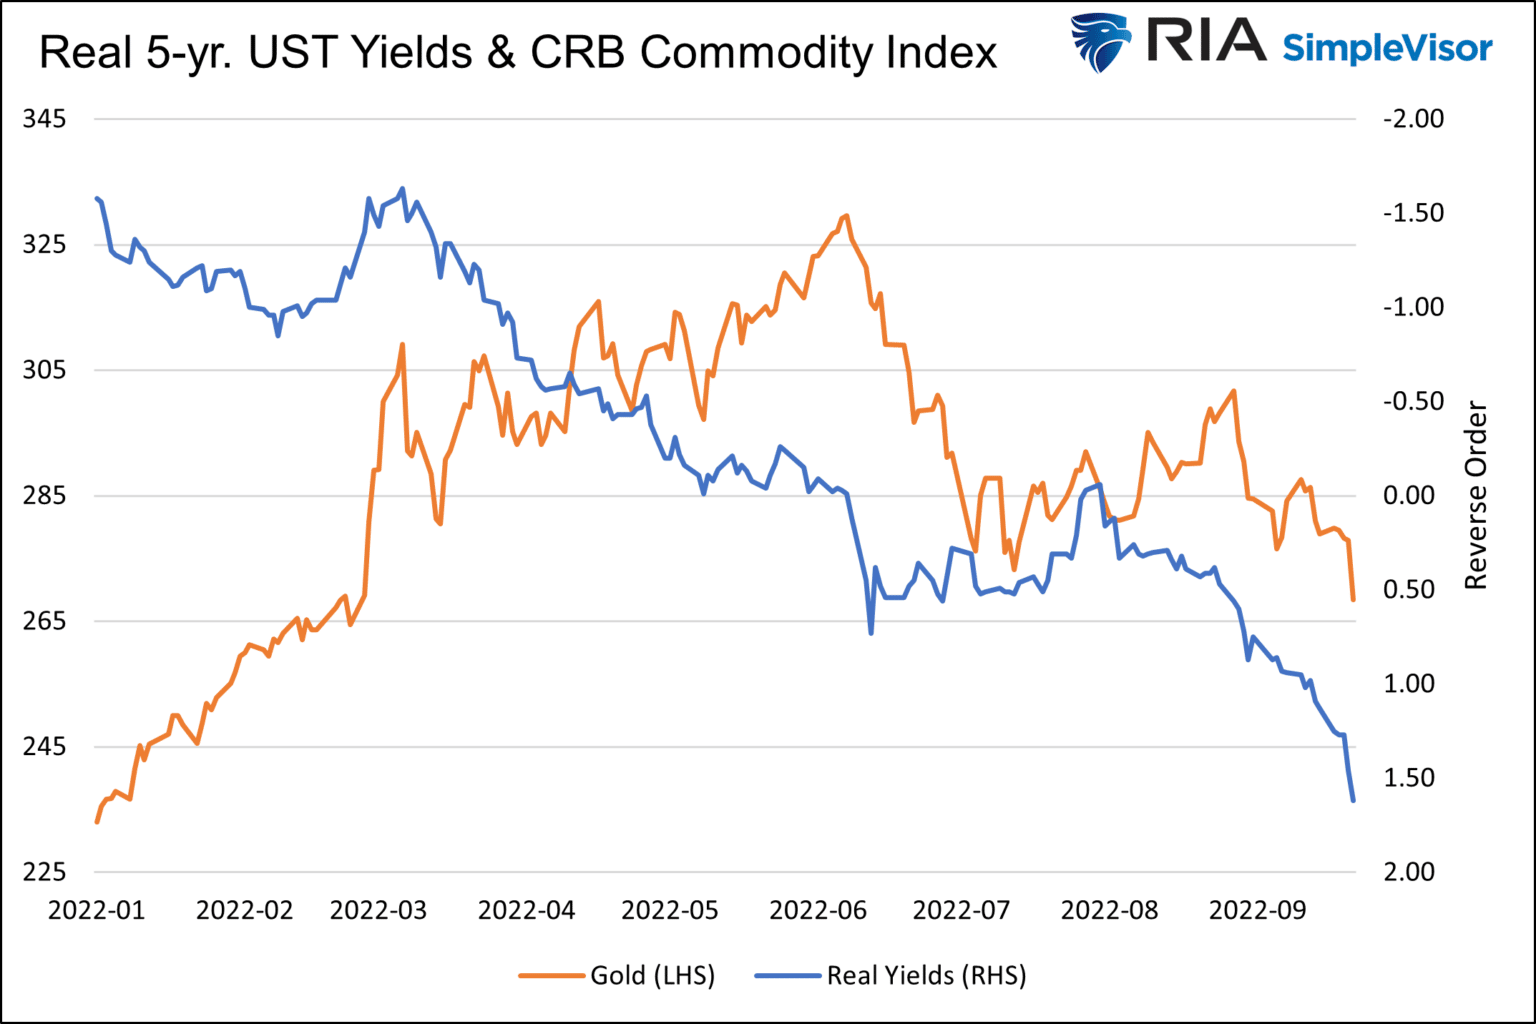
Given the strong relationship between the dollar and real yields, the inverse relationship of commodities to real yields is expected. As we did in the S&P 500 graph, the graph’s Y-axis pertaining to real yields is in reverse order.
Gold
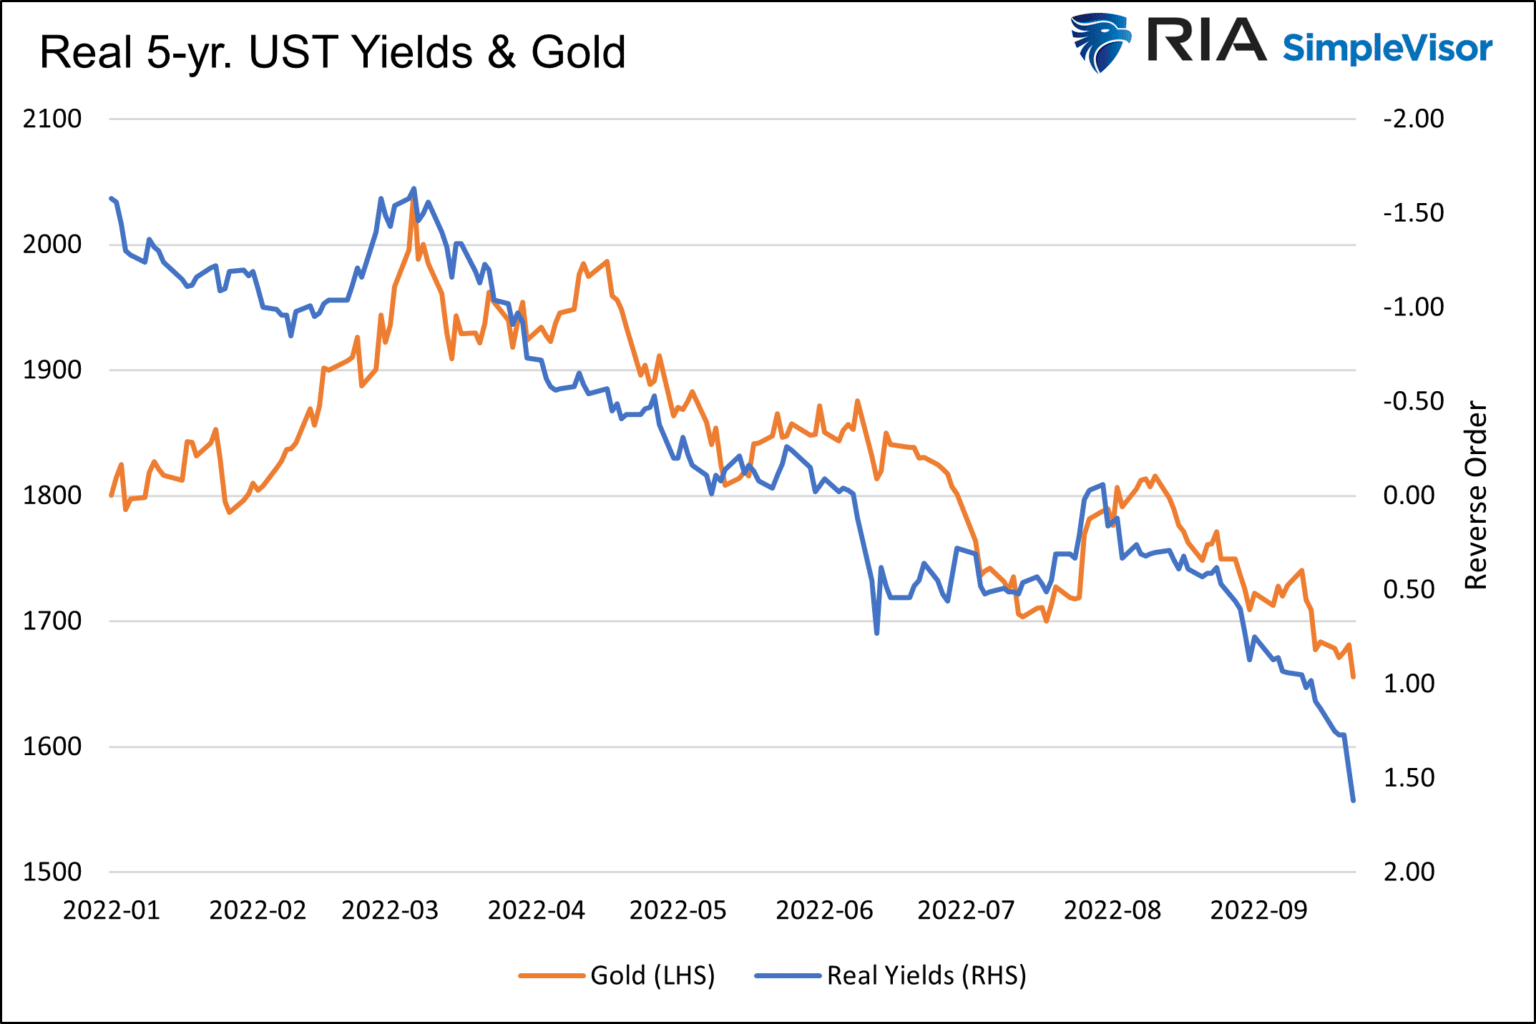
Earlier, we shared a paragraph from The Fed’s Ever-Growing Golden Footprint, which discusses how real yields are a barometer of Fed monetary policy. In particular, the article talks about the strong inverse correlation between gold and real yields, especially when real yields are negative.
The rationale is that gold prices are largely driven by monetary policy. Gold tends to trade well when the Fed is dovish and pushes real yields below zero. Real yields should never be below zero, as lenders are being punished for lending. As such, negative real yields point to too easy a monetary policy. Given that many consider gold a substitute for money, anything that decreases the value of money is good for gold. Conversely, gold trades poorly when the Fed is hawkish and a better steward of money.
Gold started the year well, rising about 10% as inflation rose and the Fed was relatively complacent. Real yields increased as the Fed grew increasingly hawkish, and the inverse correlation between gold and real yields grew strong.
The Million Dollar Question
Having seen the evidence, you must think that correctly forecasting real yields is the holy grail of investing. While it does appear that way today, relationships change. That said, let’s consider where real yields may be going.
As we showed earlier, the change in real yields is due to lower inflation expectations and much higher nominal yields. Over more extended periods, nominal yields are a function of economic growth and inflation expectations. Given that high rates are and will be a drag on economic growth and will dampen inflation, we think nominal and real yields will be headed lower over the coming months.
The current real yield on a five-year Treasury note is 1.62%. Over the last 20 years, the actual real yield attained on five-year notes has averaged 0.47%. Accordingly, five-year yields may be trading over 1% too high.
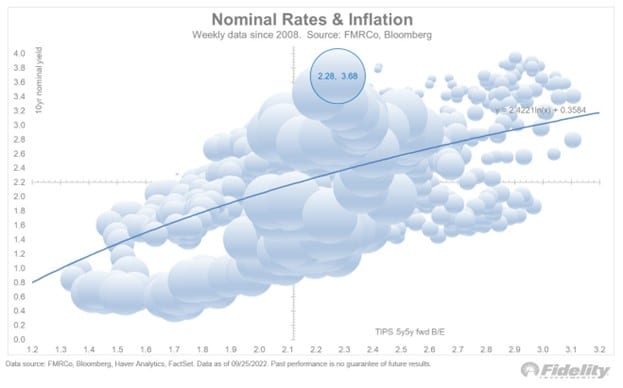
The scatter plot below from Fidelity charts weekly levels of the ten-year UST yield and 5×5 inflation expectations. The 5×5 inflation expectation is the implied five-year inflation rate expected five years from now. The current 5×5 inflation rate is 2.28%, similar to the current five-year implied inflation rate is 2.18%. As the graph shows, the current ten-year yield of 3.68% is 1.33% above the 2.35% trend line rate.
Summary
CNBC analysts spew all kinds of predictions. But for our precious time and money, we would rather turn off CNBC and instead consider that the future direction of yields may be the best investment advice today.
The U.S. economy will not function with 7% mortgage rates. The Fed may keep raising rates, but the economy will falter. With it, inflation will decline. Nominal yields should fall precipitously to catch up with inflation and growth fundamentals. Real yields should follow. If so, the outlook for stocks, bonds, gold, and commodities may be brighter than it has been. Conversely, the recent dollar strength may be close to peaking.
We end with the closing paragraph from Yields are Defying Yesterday’s Logic.
Tried and trustworthy relationships are failing bond investors. While powerful and concerning, we think the abnormal relationships are temporary. When the supply and demand for bonds normalize, bond investors will likely realize that economic, inflation, and other factors warrant much lower yields.