
Trending

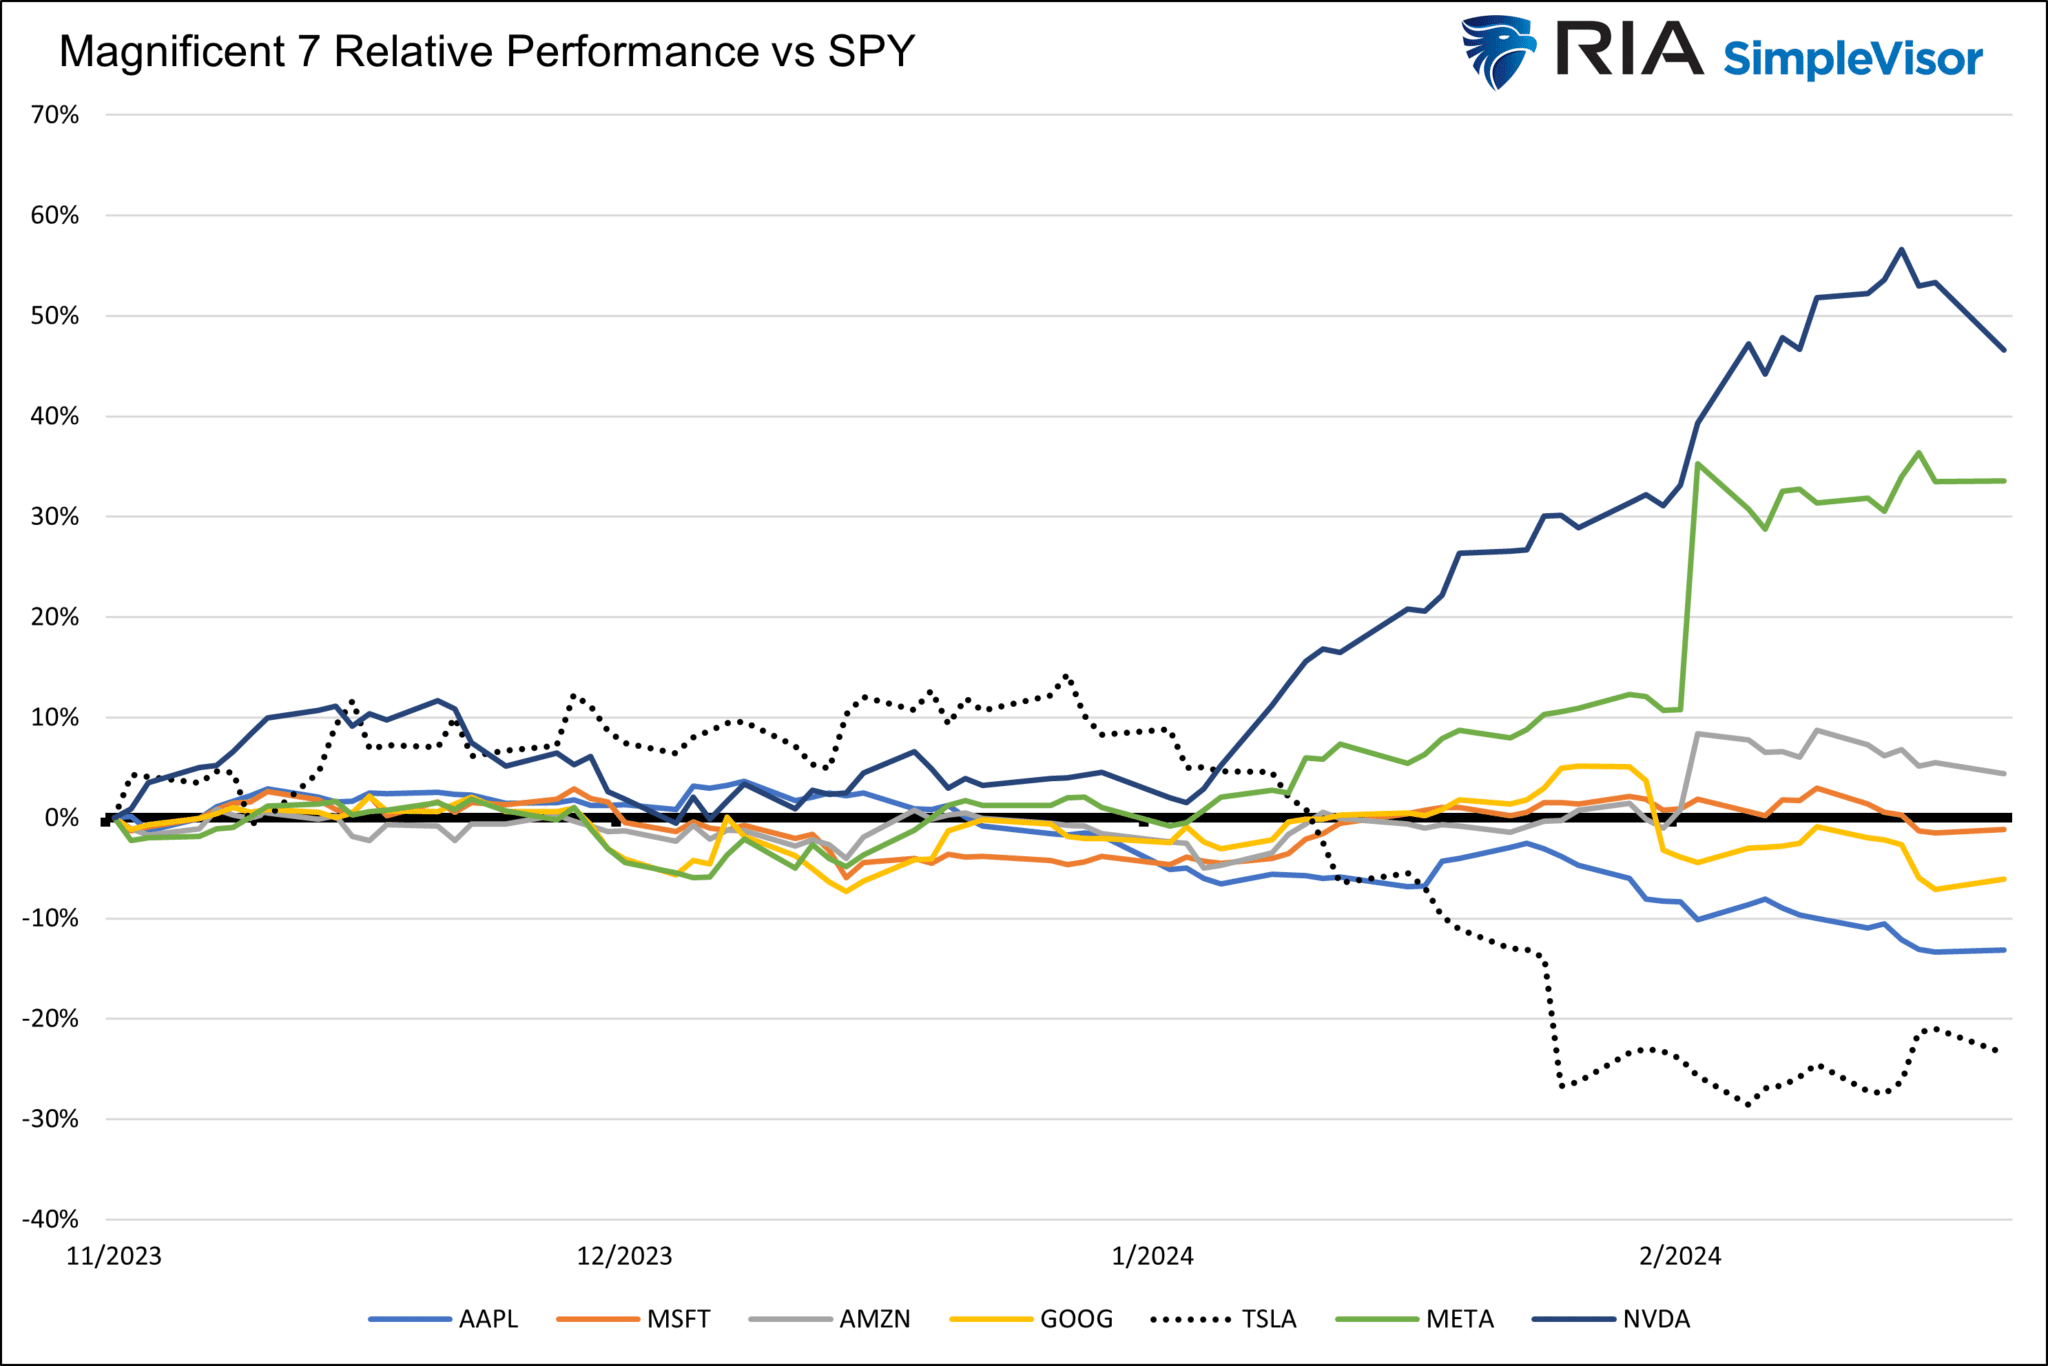
The Magnificent Seven hog the headlines and are the envy of many investors. Yet since the start of 2024, only two Magnificent Seven stocks have been beating the market significantly. The graph below shows the relative performance of each stock versus the S&P 500. As shown, the Magnificent Seven traded in a unified fashion from November 1, 2023, when the market started rallying on hopes for Fed rate cuts. However, with the start of the new year, the Magnificent Seven is splintering, with only two stocks leading the way. NVDA and META are handily beating the market. Amazon is the only other stock outside of the “Magnificent Two” beating the market this year. Apple and TSLA, shall we say the “Un-Magnficent Two,” have significantly lagged the market.
The question on many investors’ minds is whether the Magnificent Seven is a bubble or whether their high valuations properly reflect the potential for higher-than-market earnings growth. To put the question in historical context, we wrote Are The Magnificent Seven In A Bubble? The article compares the mania surrounding the seven stocks to the Nifty Fifty of the late 1960s and early 1970s. Surprisingly, it turns out the high valuations of the Nifty Fifty were justified. However, the risk is not just the combination of high valuations and weaker-than-expected earnings growth but, maybe more importantly, a loss of confidence.
What To Watch
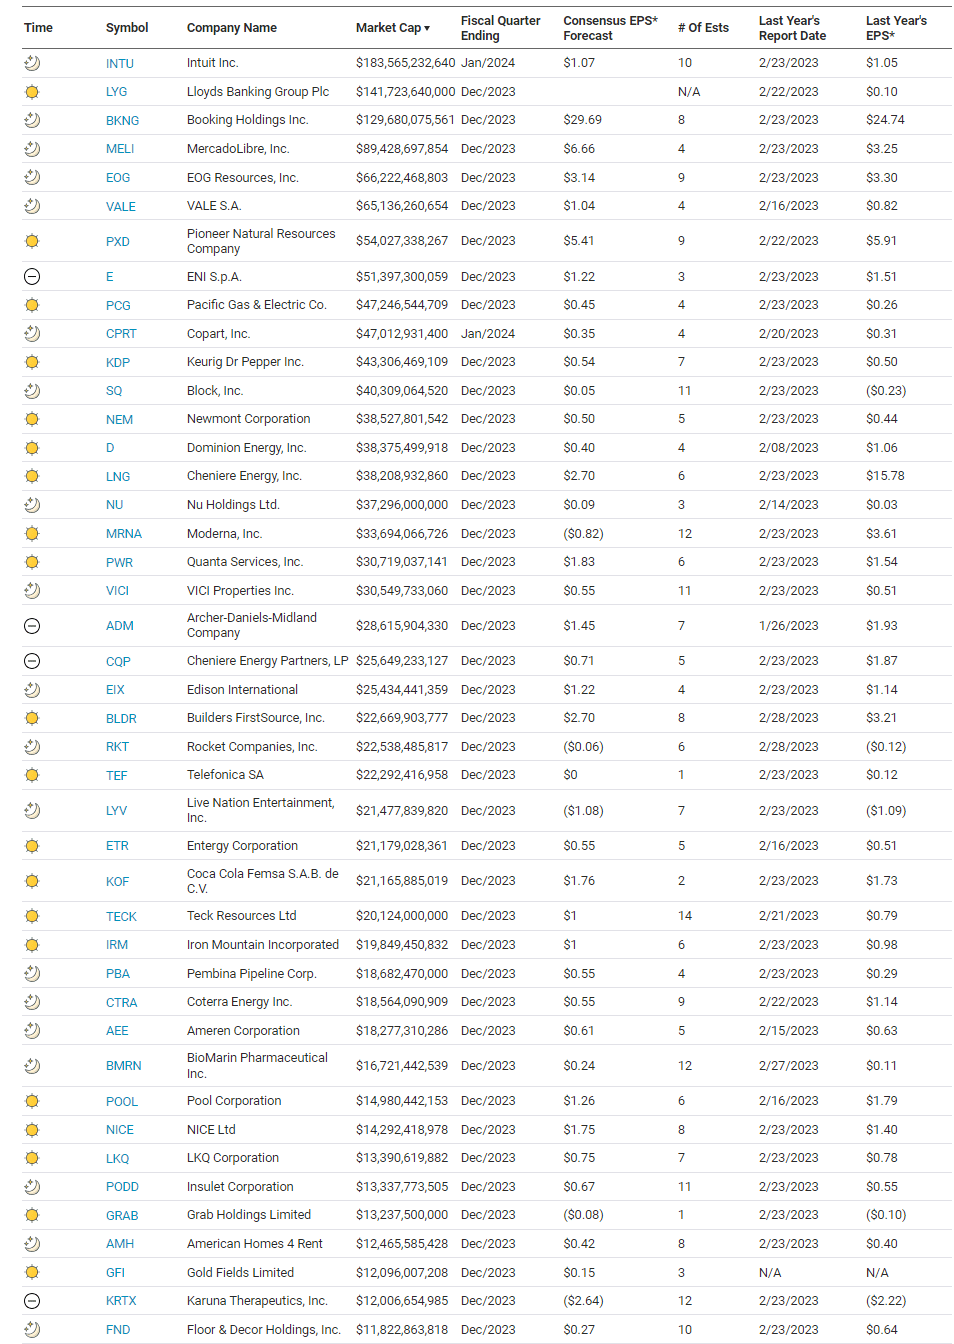
Earnings
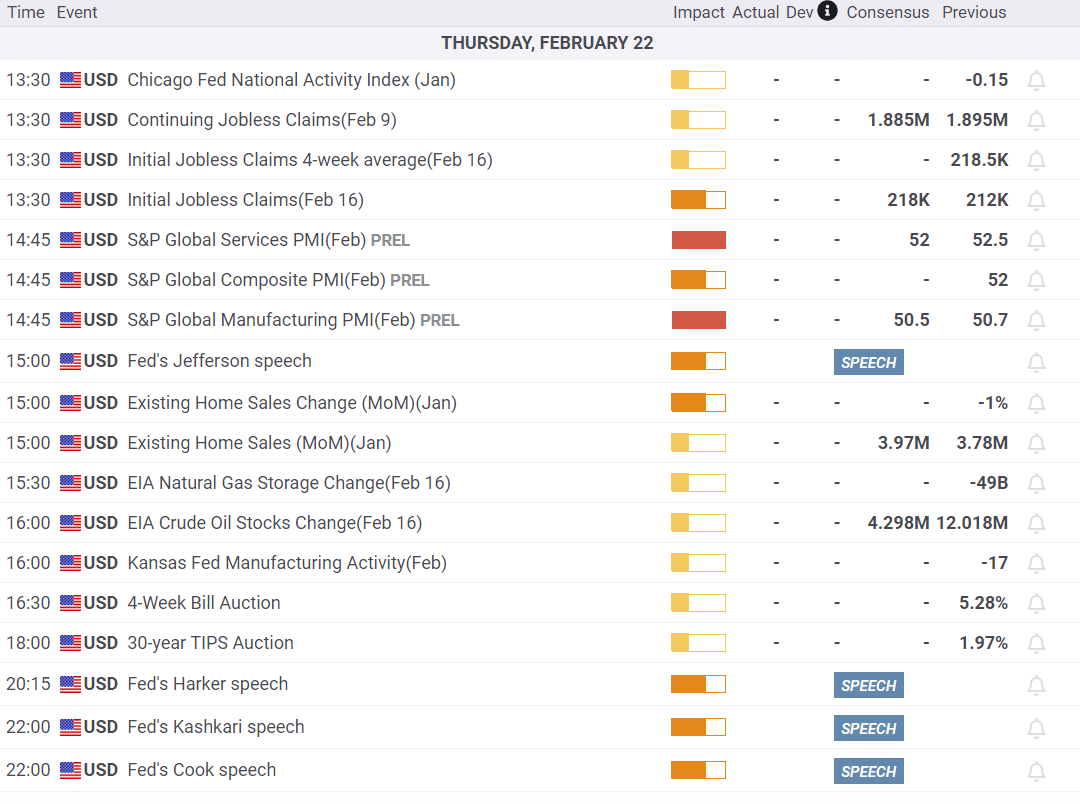
Economy
Market Trading Update
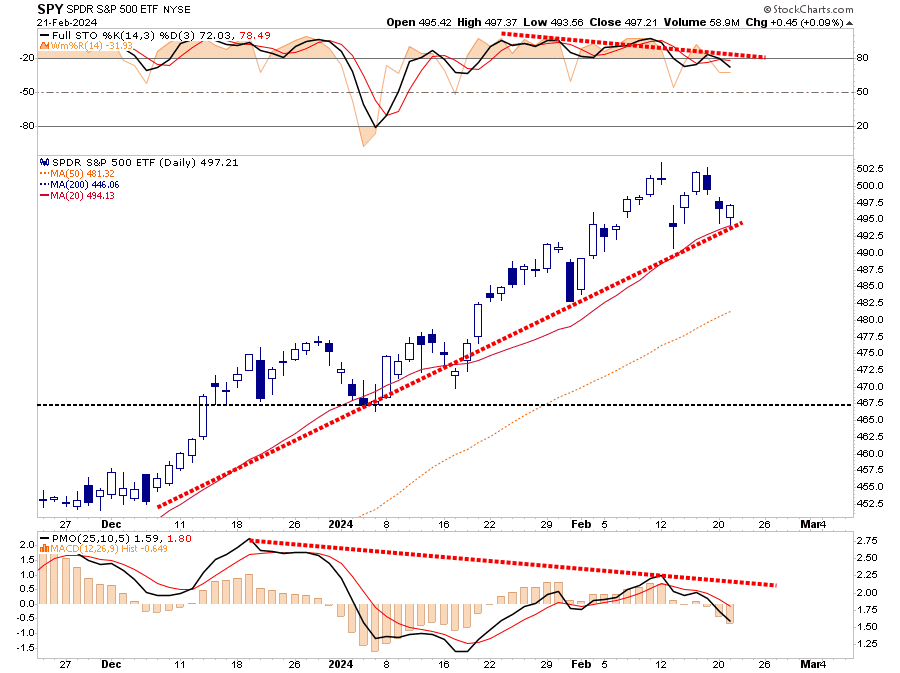
Despite poor guidance from Palo Alto Networks yesterday, which pulled the market lower, it continues to hold onto rising trendline support coinciding with the 20-DMA. As noted yesterday, the selloff this week did trigger a MACD sell signal. As shown, there is a negative divergence between momentum indicators, which are waning, and the rising bullish market.
While such a divergence can last for a while, they usually resolve themselves with lower asset prices and more deeply oversold conditions. With bullish sentiment still very elevated, it is likely that we have more work to do before the current correction/consolidation is complete.
We are watching the 20-DMA very closely, which is our first indication that the recent rally may end. Continue managing risk exposures for now. With Nvidia’s blowout quarter on revenue and earnings last night, the market should get a lift today, defending the bullish trend for now, so no major concerns about a risk-off environment currently.
More On The Magnificent Two And Valuations
Our article from the opening (Are The Magnificent Seven in a Bubble?) uses logic by famed investor Jeremy Seigel. 26 years after the Nifty Fifty stocks peaked, he looked back on their high valuations and subsequent earnings growth to determine which stocks were cheap, fairly valued, or expensive at the top of the bubble.
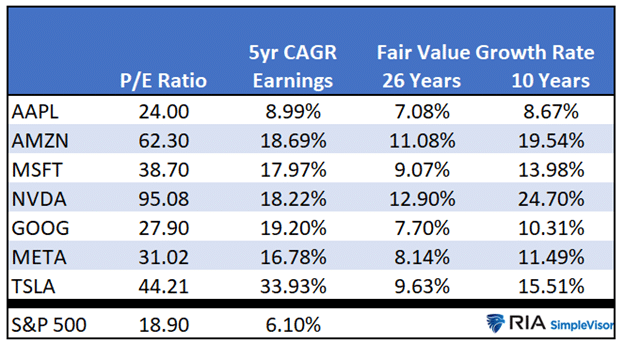
Without the benefit of hindsight, we can’t appreciate how the seven stocks will grow their earnings, but we can calculate the earnings growth that would justify current valuations. Per the article:
For example, as shown in the table below, Amazon (AMZN) has a P/E ratio of 62.30, more than three times the S&P 500 (18.90). Before forming an opinion, consider that AMZN has grown its earnings at three times the rate of the S&P 500 over the last five years. For AMZN to perform in line with the market, assuming its P/E falls to market levels, its earnings must grow annually by 19.54% over the next ten years or 11.08% over the next 26 years.
Whether you are focused on the Magnificent Two or Seven, or for that matter, any stock, the analysis we employ can help investors appreciate whether a stock’s relative valuation versus the market is fair.
Is Consumer Confidence About Politics, Not Economics?
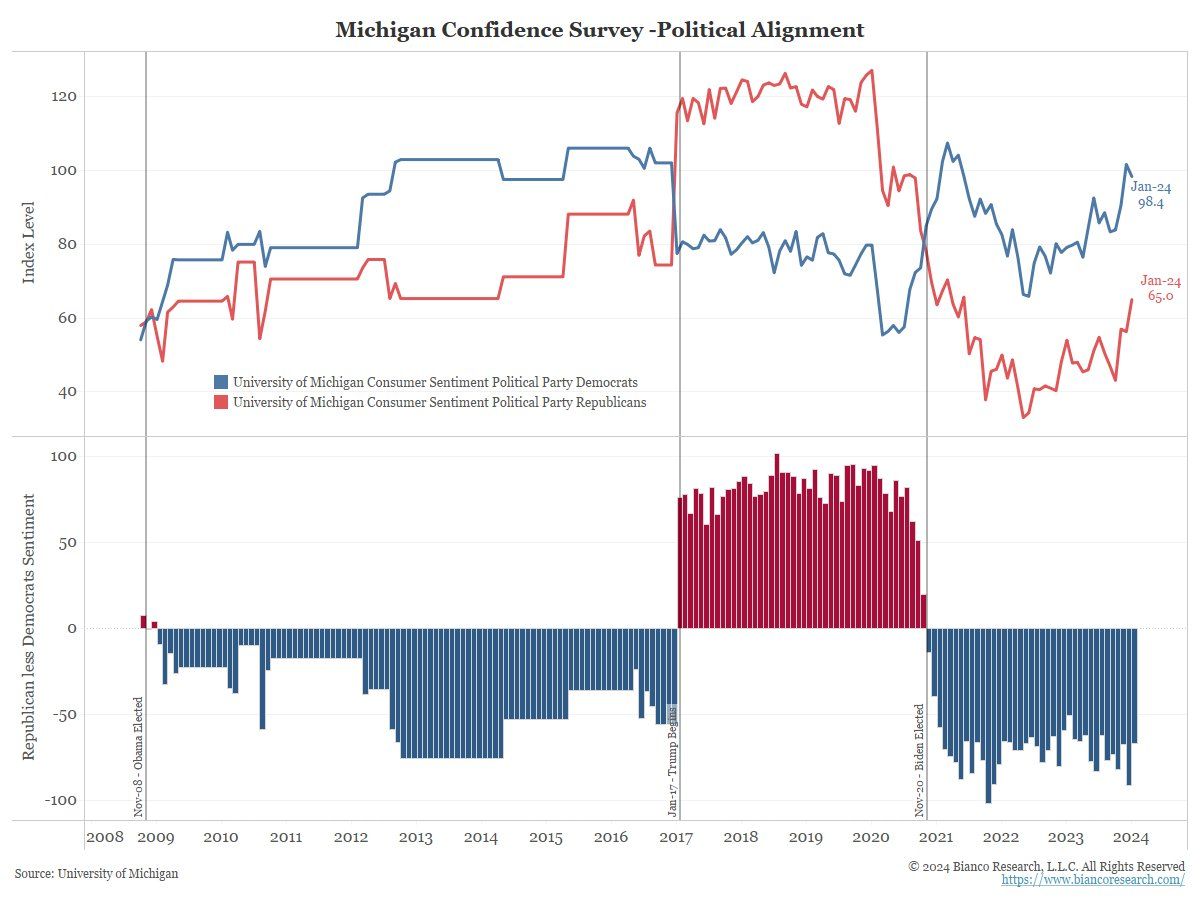
The graph below from Jim Bianco is very telling in trying to answer our question. As shown, confidence among Democrats and Republicans shifts with the party of the President. While confidence readings by political party tends to trend in the same direction, they move in opposite directions at the election. Per Jim Bianco:
This is why I call consumer confidence polls “the world’s most useless economic statistic.” Because it is not an economic statistic, it is a political statistic!
We do not necessarily agree with Jim. Many governmental economic statistics are incredibly complex and can not accurately capture the state of the economy or inflation. Similarly, sentiment surveys can be highly biased, as we show. However, the trends of confidence surveys do a reasonable job of telling us whether sentiment is improving or declining. Given the consumer represents about two-thirds of economic activity, changes in confidence should be an important factor in projecting economic growth.
Tweet of the Day
“Want to have better long-term success in managing your portfolio? Here are our 15-trading rules for managing market risks.”
Related: Corporations Are Hoarding Cash