
Written by: David Lovell | Swan Global Investments
News outlets and financial media are awash with experts and politicians using the term “strong” to assuage investor and voter concerns about the state of the U.S. economy and a potential recession.
Our Treasury Secretary Janet Yellen, Chair of the Federal Reserve Jerome Powell and a heap of economists and financial news outlets have pointed to a “strong” labor market and a “strong consumer” as signals that the direction of the economy is not as bad as some may fear.
For investors, a holistic assessment of the economy is a critical consideration when making risk mitigation and capital allocation decisions. As such, perhaps we should focus on assessing the economy’s overall health and potential for sustained growth, versus looking at signals of “strength” that may be fleeting or limited in diagnostic value.
Like a doctor examining a patient, there is a key difference between being strong versus healthy. For example, someone that can lift a heavy weight several times could reasonably be perceived of as strong. But that’s a narrow view of the person’s overall health, physical capability, or longevity. That strong person may in fact be unhealthy below the surface.
The main data referenced to support assertions of our “strong” labor market is a low unemployment rate and rising wages. The “strong” consumer argument has been supported by recent consumer spending data.
Putting aside the fact that these are mostly lagging indicators, the data do not speak to the overall health of the U.S. labor market or the U.S. consumer. A look at other data may signal an unhealthy state for both and deeper underlying issues for investors to grapple with going forward.
Unemployment Rate vs. Labor Participation – Strong vs. Healthy Indicators
A low unemployment rate may signal a strong labor market—unless it doesn’t. A preponderance of “Help Wanted” signs and the “Great Resignation” were evidence to many of a “strong” jobs market and a good sign for the overall economy. But it is important to point out just how fast the labor market can shift from adding jobs, and even paying higher wages, to hiring freezes and layoffs.
This chart of the U.S. Unemployment Rate shows the speed of change in the labor market in the past several recessions:
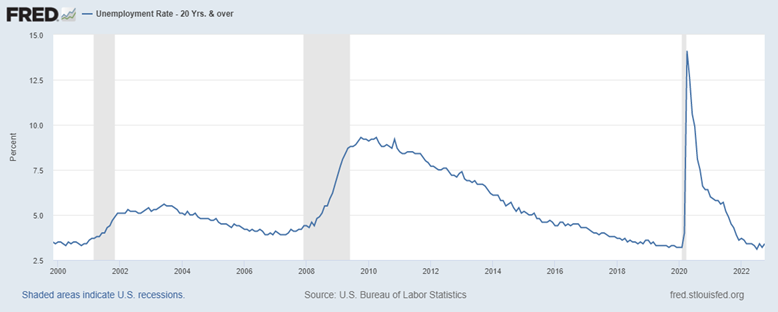
- March 2001 – unemployment rate was 3.7%; just 12 months later it was 5.1%
- November 2007 – unemployment rate was 4.2%; just12 months later it was 6.2%, and it reached 9.2% 12 months after that (November 2009).
- COVID was an anomaly, but in just two months from February to April of 2020, the unemployment rate spiked from 3.2% to 14.1%, before rapidly falling to the low 3% range again.
As of October of 2022, the unemployment rate is at 3.7% (up from a recent low of 3.5% in July). But that could quickly change as we’re increasingly seeing signs and hearing forecasts of an impending recession. A recent survey by PWC of domestic company CEOs and another global company CEO survey by KPMG indicate that roughly 50% are planning for layoffs and don’t feel the consumer will save the economy from recession.
So perhaps the more relevant questions for investors are, “how healthy is that labor market?” and “what labor market data should we be watching?”
The Bureau of Labor Statistics defines the unemployed as those working-aged people (over age 16) who ““do not have a job, have actively looked for work in the prior four weeks, and are currently available for work.” The unemployment rate can therefore decline either when the unemployed find a job, when they no longer look for work, or when they decide to drop out of the labor force altogether (give up, retire, etc.). Also, after 26 weeks the unemployed are also no longer counted—even if they are still looking for work—in the unemployment rate calculation.
As such, the unemployment rate is a trailing figure and has its flaws in elucidating the true picture of the jobs market. A low unemployment rate is not necessarily a sign of economic strength, but perhaps a sign of structural weakness or an unhealthy job market.
On the other hand, the labor force participation rate provides a view of the economy’s active workforce—the percentage of working-aged people (over age 16) actively working or seeking jobs relative to the overall civilian, working-aged population. Even as the latest October jobs report shows over 260,000 jobs were added in the month (albeit below expectations), a deeper look reveals a mixed labor market picture as the participation rate dropped.
Looking at the labor market through this participation lens, an underlying unhealthy condition seems to be metastasizing within the economy. In fact, this chart shows the U.S. labor force participation rate has been falling for some time.
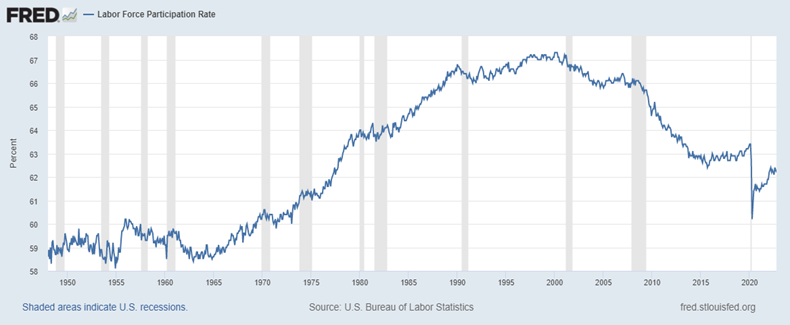
As of September, the US labor force participation rate was 62.3. While we dipped down below that figure very briefly due to COVID-19 lock-downs, the US has fallen from peak levels between 1990 and 2000 and remained mired in the 62 range since 2013—a level we hadn’t been seen before since the mid-to-late 1970’s.
At first glance, one may dismiss the declining rate of labor participation, pointing to several factors such as the great productivity gains realized from the Internet and numerous technological advances and/or the natural demographic transition afoot with Baby Boomers retiring. While there are a host of trends and factors at play in the participation rate, this indicator is one to watch more so than the unemployment rate when seeking to diagnose the health of the overall labor market.
Why is our current lower level of labor participation problematic?
Over the longer term, a sustained lower level of labor force participation may have more unhealthy knock-on effects such as a drop in productivity rates and rising social services costs as people turn to government support.
Recent data points to a drop in overall productivity, as this chart below indicates. It is worth noting that the current productivity level has not been seen since the 1970s’.
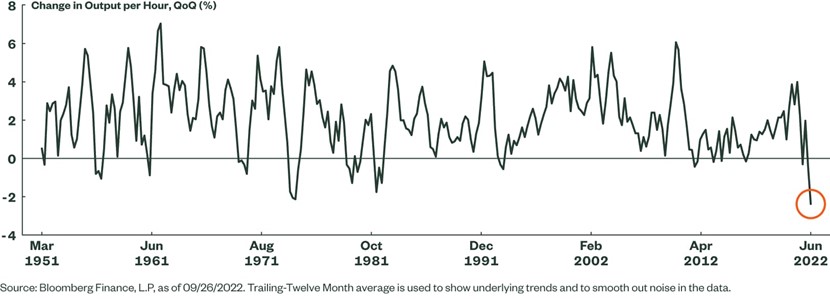
Chart courtesy of State Street Global Advisors.
Michael Arone, CFA, Chief Investment Strategist at State Street Global Advisors, provides a simple and clear assessment in a recent post titled ” Uncommon Sense:
“Simply stated, an increasing number of workers are producing less per hour. And, in today’s bizarre post-pandemic environment workers are getting paid more for producing that shrinking output. For example, Unit Labor Costs — how much a business pays its workers to produce one unit of output — rose 10.2% in the second quarter, following a 12.7% surge in the first quarter.1[i] Continued strong increases in employment while output is weak or falling are not sustainable.”
The long-term health of an economy is in part reliant on the participation and productivity of those within the economy. If too few work, or if too little production is generated, the system will not work at optimal levels over time. If the labor pool is too under-skilled or if too many incentives not to work exist, productivity will suffer and/or the numbers of those unwilling to work rise.
Examining the overall health of the system may be more useful for investors than “signs of strength”. An unhealthy condition within the labor market (persistent low levels of participation) can begin and fester while being covered up by a facade of strength (unemployment rate).
[i] “Productivity and Costs, Second Quarter 2022, Revised,” Bureau of Labor Statistics, September 1, 2022.
Consumer Spending vs. Consumer Debt – Strong vs. Healthy
Indeed corporations like American Express and Amazon have indicated strong consumer spending levels since COVID hit. The consumer’s ability to spend (strength) has been “juiced” by historic levels of fiscal and monetary stimulus in response to the pandemic that have taken years to work through the economy.
Like an extreme pre-workout drink, all of that stimulus creates a sensation of great potential and drives exertion. However, maybe we took too much pre-workout drink, and it has lasted too long.
Consumers initially saved much of that potential fuel (direct payments and other COVID-stimulus) as they literally couldn’t spend it in a supply-depleted and semi-locked-down world. That extra liquidity found its way mostly into the stock market, Amazon orders, streaming services, and outdoor activities. Overall, there was a net savings rate increase. However, once the world began reopening more of that potential spending was unlocked.
This chart shows the growth in consumer credit card and revolving debt levels over the past 20+ years.
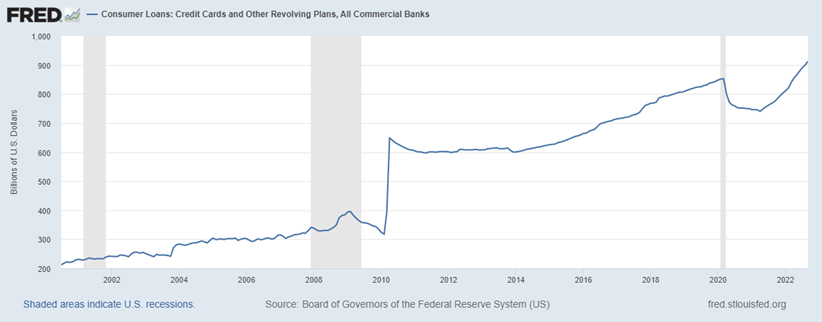
In general, U.S. consumers will do what is necessary to maintain their lifestyle, until they can’t any longer. However, an unhealthy spending pattern rapidly becomes problematic as prices rise. As the stimulus checks ran out, the “excess” savings was rapidly depleted, leading consumers to tap credit cards and pile on debt at the fastest rate in 15 years, according to the Fed, even as interest rates rise.
This chart shows the annualized rate change in the level of the U.S. consumer’s credit card debt. Through this lens, one can see the rapid rate at which debt is being added as inflation eats away at the consumer’s buying power.
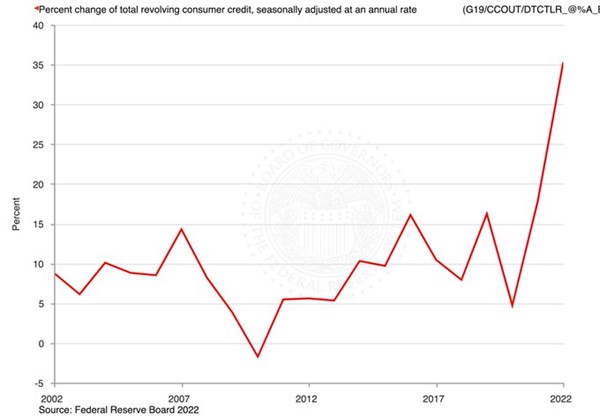
The “juiced” up spending initially created an unhealthy level of inflation for the economy, which is now causing broader damage to the consumer’s personal finances and threatening the economy’s growth prospects.
While we’re told the U.S. Consumer is “strong”, this rapid increase in consumer debt indicates the consumer, or “the patient”, so to speak, isn’t very healthy. Further, concerning the consumer’s overall financial standing, if housing prices and the stock market continue to soften, then household balance sheets won’t be so healthy either, contrary to what our Treasury Secretary, the Federal Reserve, and others have said.
Sharp increases in interest rates, particularly in a heavily indebted economy, are problematic as debt servicing requirements and borrowing costs surge. Interest rate spikes alone can destabilize an economy, but when combined with a surging dollar and inflation, the risks of market instability increase markedly.
Navigating Challenges of an Unhealthy Economy
Investors have suffered a nasty bite from the bear market so far this year and uncertainty about the overall economy and the direction the markets will take from here remains high.
The marketplace is deeply divided between bulls and bears. There is plenty of data for both sides to point to, but the number of economic headwinds that investors must consider is daunting: persistent supply challenges, sticky inflation, a Fed dedicated to rapidly hiking interest rates and reducing liquidity, widening credit spreads, the aforementioned unhealthy state of the U.S. consumer and labor market, forecasts for recession ahead, a very strong US dollar, and heightened geopolitical risks, just to name a few.
In the face of these unhealthy conditions, stocks and bonds have fallen in tandem—both domestically and globally. This market dynamic is a painful reminder that assumed historic correlations between different asset classes will not always persist into the future—that diversification through asset allocation alone may evaporate when investors need it most.
Navigating the challenges in this environment may require a redefined approach to portfolio construction. To achieve long-term goals, investors need to capture portfolio gains where possible to outpace persistently elevated inflation. At the same time, risk management is of utmost importance in this environment.
U.S. equities have been the best long-term performing asset class, offering perhaps the best long-term option to combat inflation. Therefore, investors should consider strategies that can offer equity market participation while mitigating risk.
Given the fact equities can be volatile, investors may benefit from strategies that combine equity market participation with risk mitigation elements to address volatility. Options-based, hedged equity strategies offer such a combination, without relying on bonds, and may provide a path to navigate periods of unhealthy conditions in capital markets.