
Trending

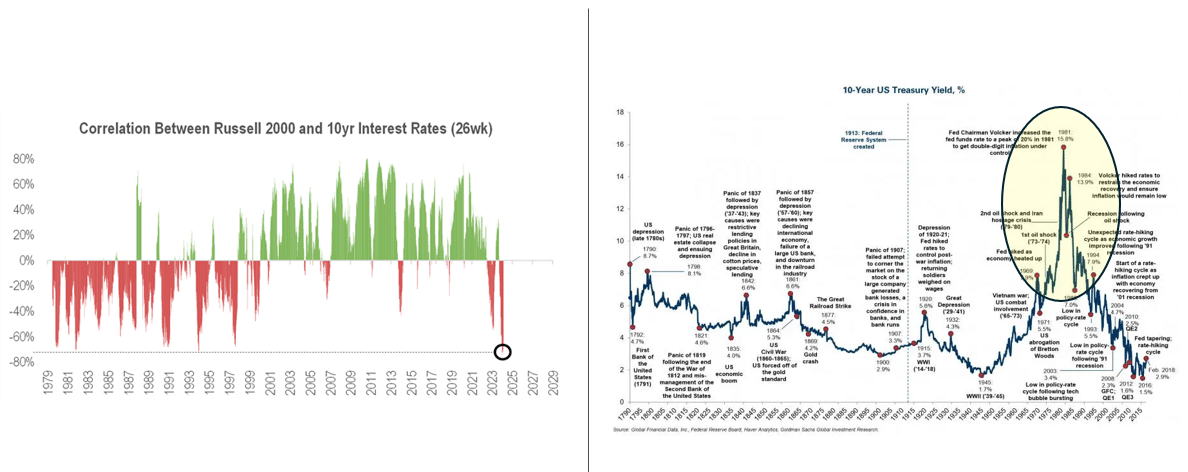
As shown on the left, from 1979 until 2000, the correlation between small cap returns (Russell 2000) and the U.S. Treasury ten-year yield was often highly negatively correlated. As circled in the graph on the right, the U.S. experienced its highest yields in history during this period. Due to their high debt loads, small cap stocks are interest rate sensitive. Therefore, bouts of higher rates resulted in weaker returns during this period. Conversely, when yields were declining, small cap stocks performed well. By 2000, yields fell to more historic levels. From 2000-2019, the relationship between small caps and yields became positive. Small cap investors were keying in on economic factors without the onus of high interest rates. Higher yields, albeit low compared to the prior period, often accompanied more robust economic growth and better earnings for small caps.
With the recent inflation and higher rates, the negative correlation between yields and small cap returns is back. Do small cap stock investors worry that a redux of higher inflation is returning? Or, might they be concerned that small-cap stocks do not have the same pricing power as larger-cap stocks and, thus, are negatively affected by higher inflation? Regardless of why the correlation has flipped, the small cap index now serves as a proxy for inflation and yields. Might small cap stocks be a safe port in the storm if a recession hits, or might the correlation turn positive?
Market Trading Update
Earlier this week, I discussed the interesting chart setup for longer-duration bonds. To wit:
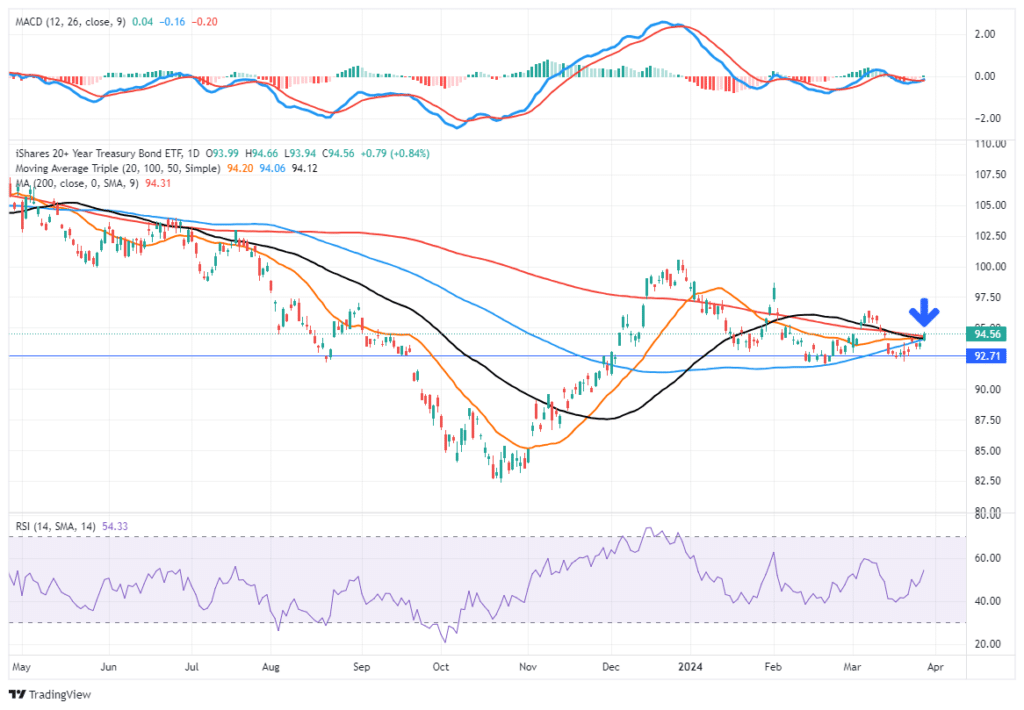
“On another note, the 20-Year Duration Treasury Bond chart looks much more bullish. A massive cluster of resistance is just above current bond prices, which have built nice support along previous lows. As the economy continues to weaken, and if the Fed does cut rates in June, bond prices will rise. Once prices clear that cluster of support, there is very little resistance to a further decline in yields and a rise in prices.”
I suggested that the resistance challenge could take a few months before breaking higher, coinciding with the Fed cutting rates. However, bond prices have rallied this week, and prices cleared most of that moving average resistance. While the move is early, it is a bullish indication for bonds with prices improving. I would not be surprised to see bonds struggle with this near term technical resistance. However, if bonds can build support above these averages and turn them into support levels, the outlook becomes more bullish. Furthermore, with the MACD turning onto a buy signal, such should provide additional lift to bond prices over the next month.
A Relative Opportunity In Apple
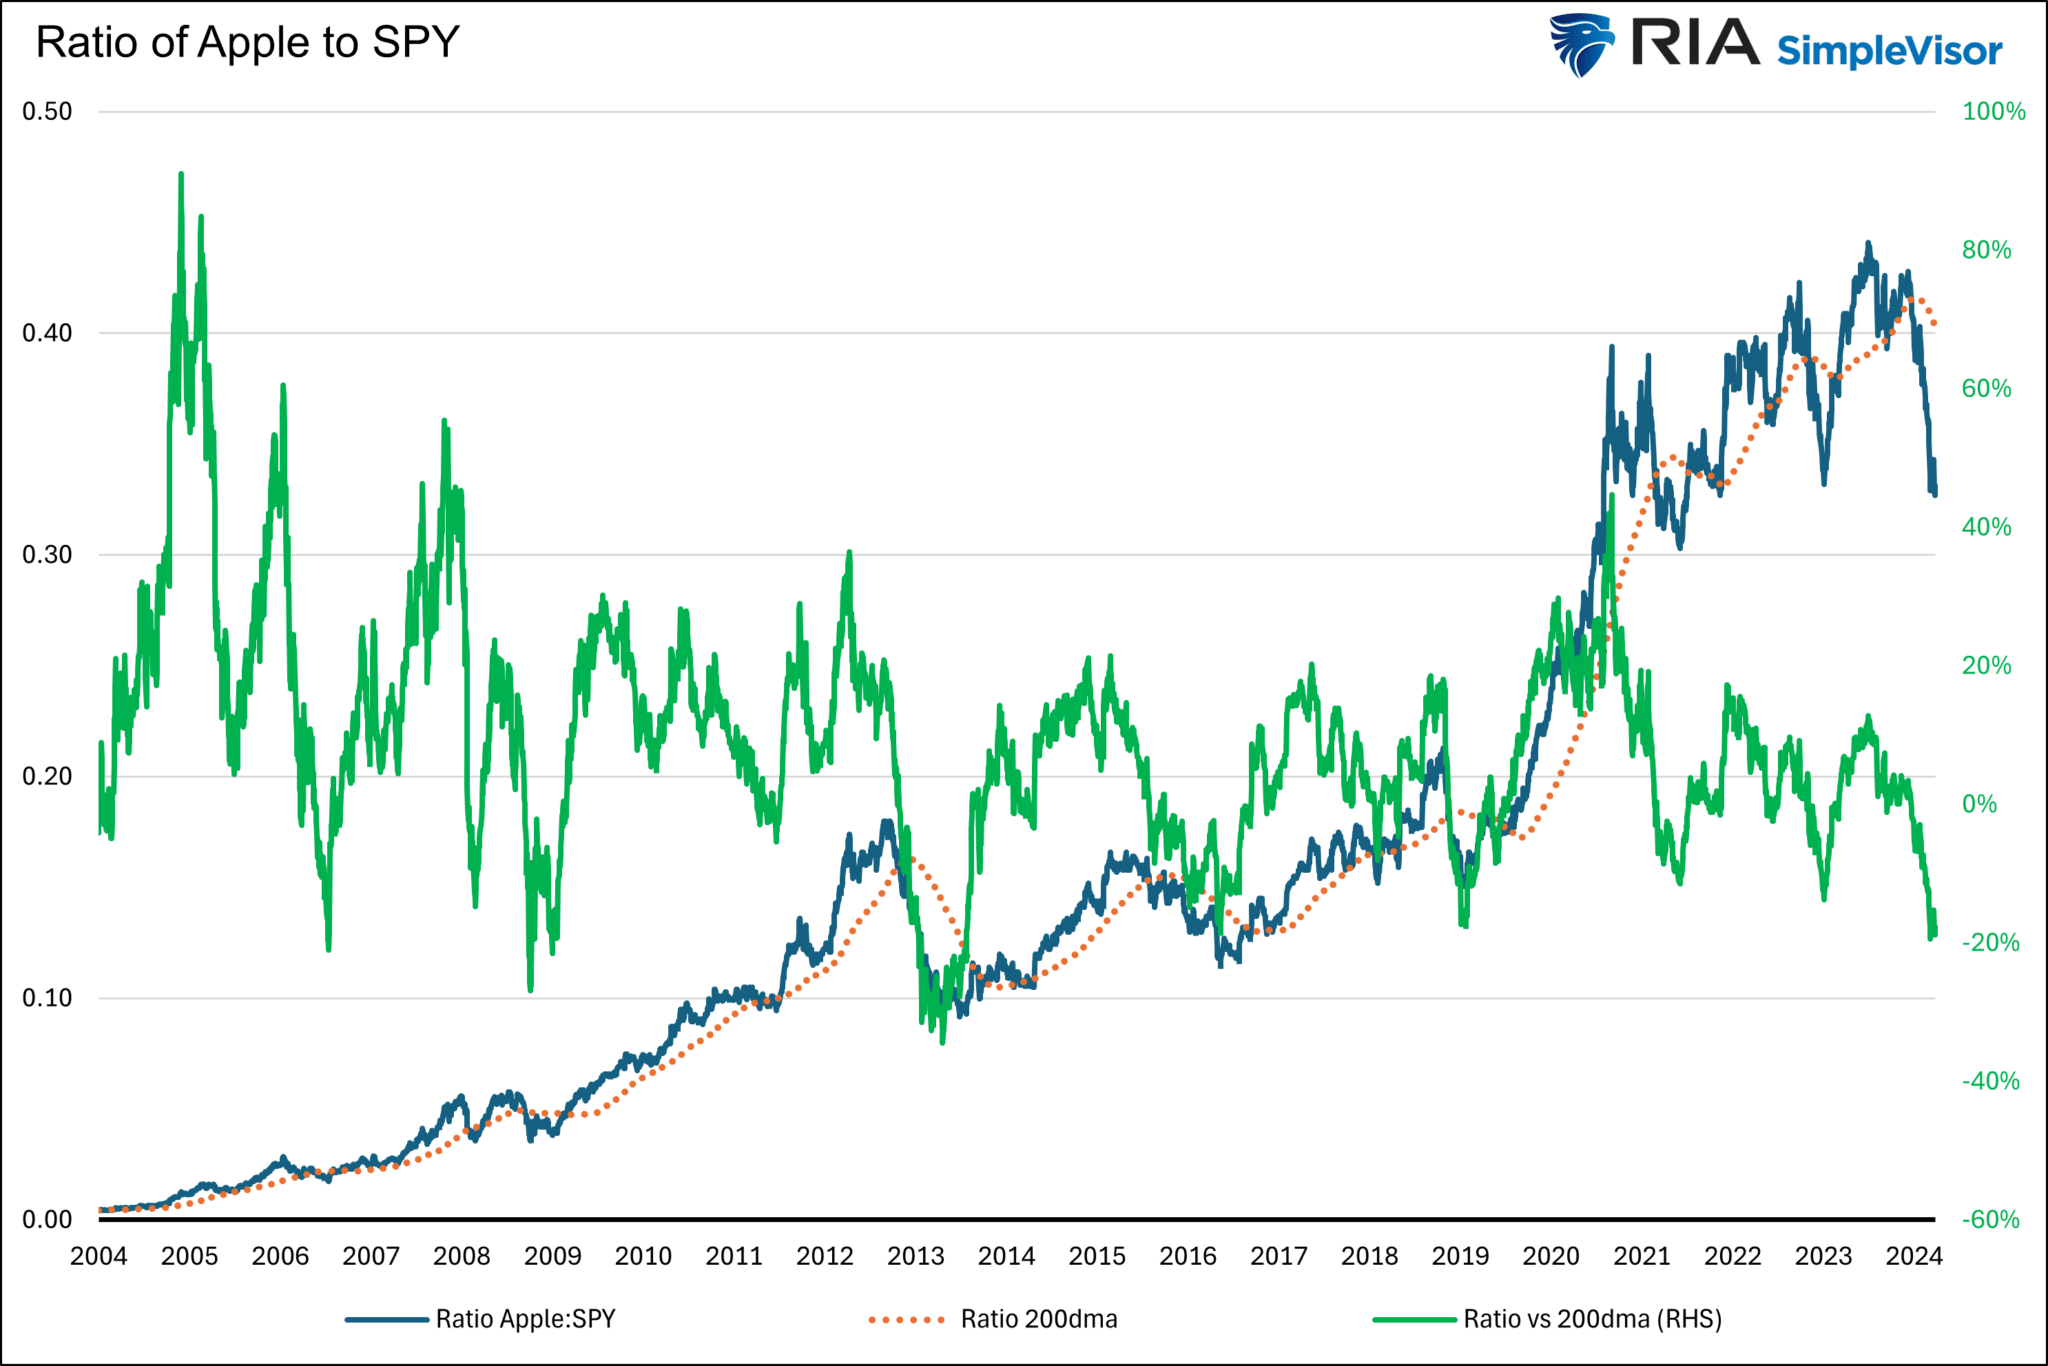
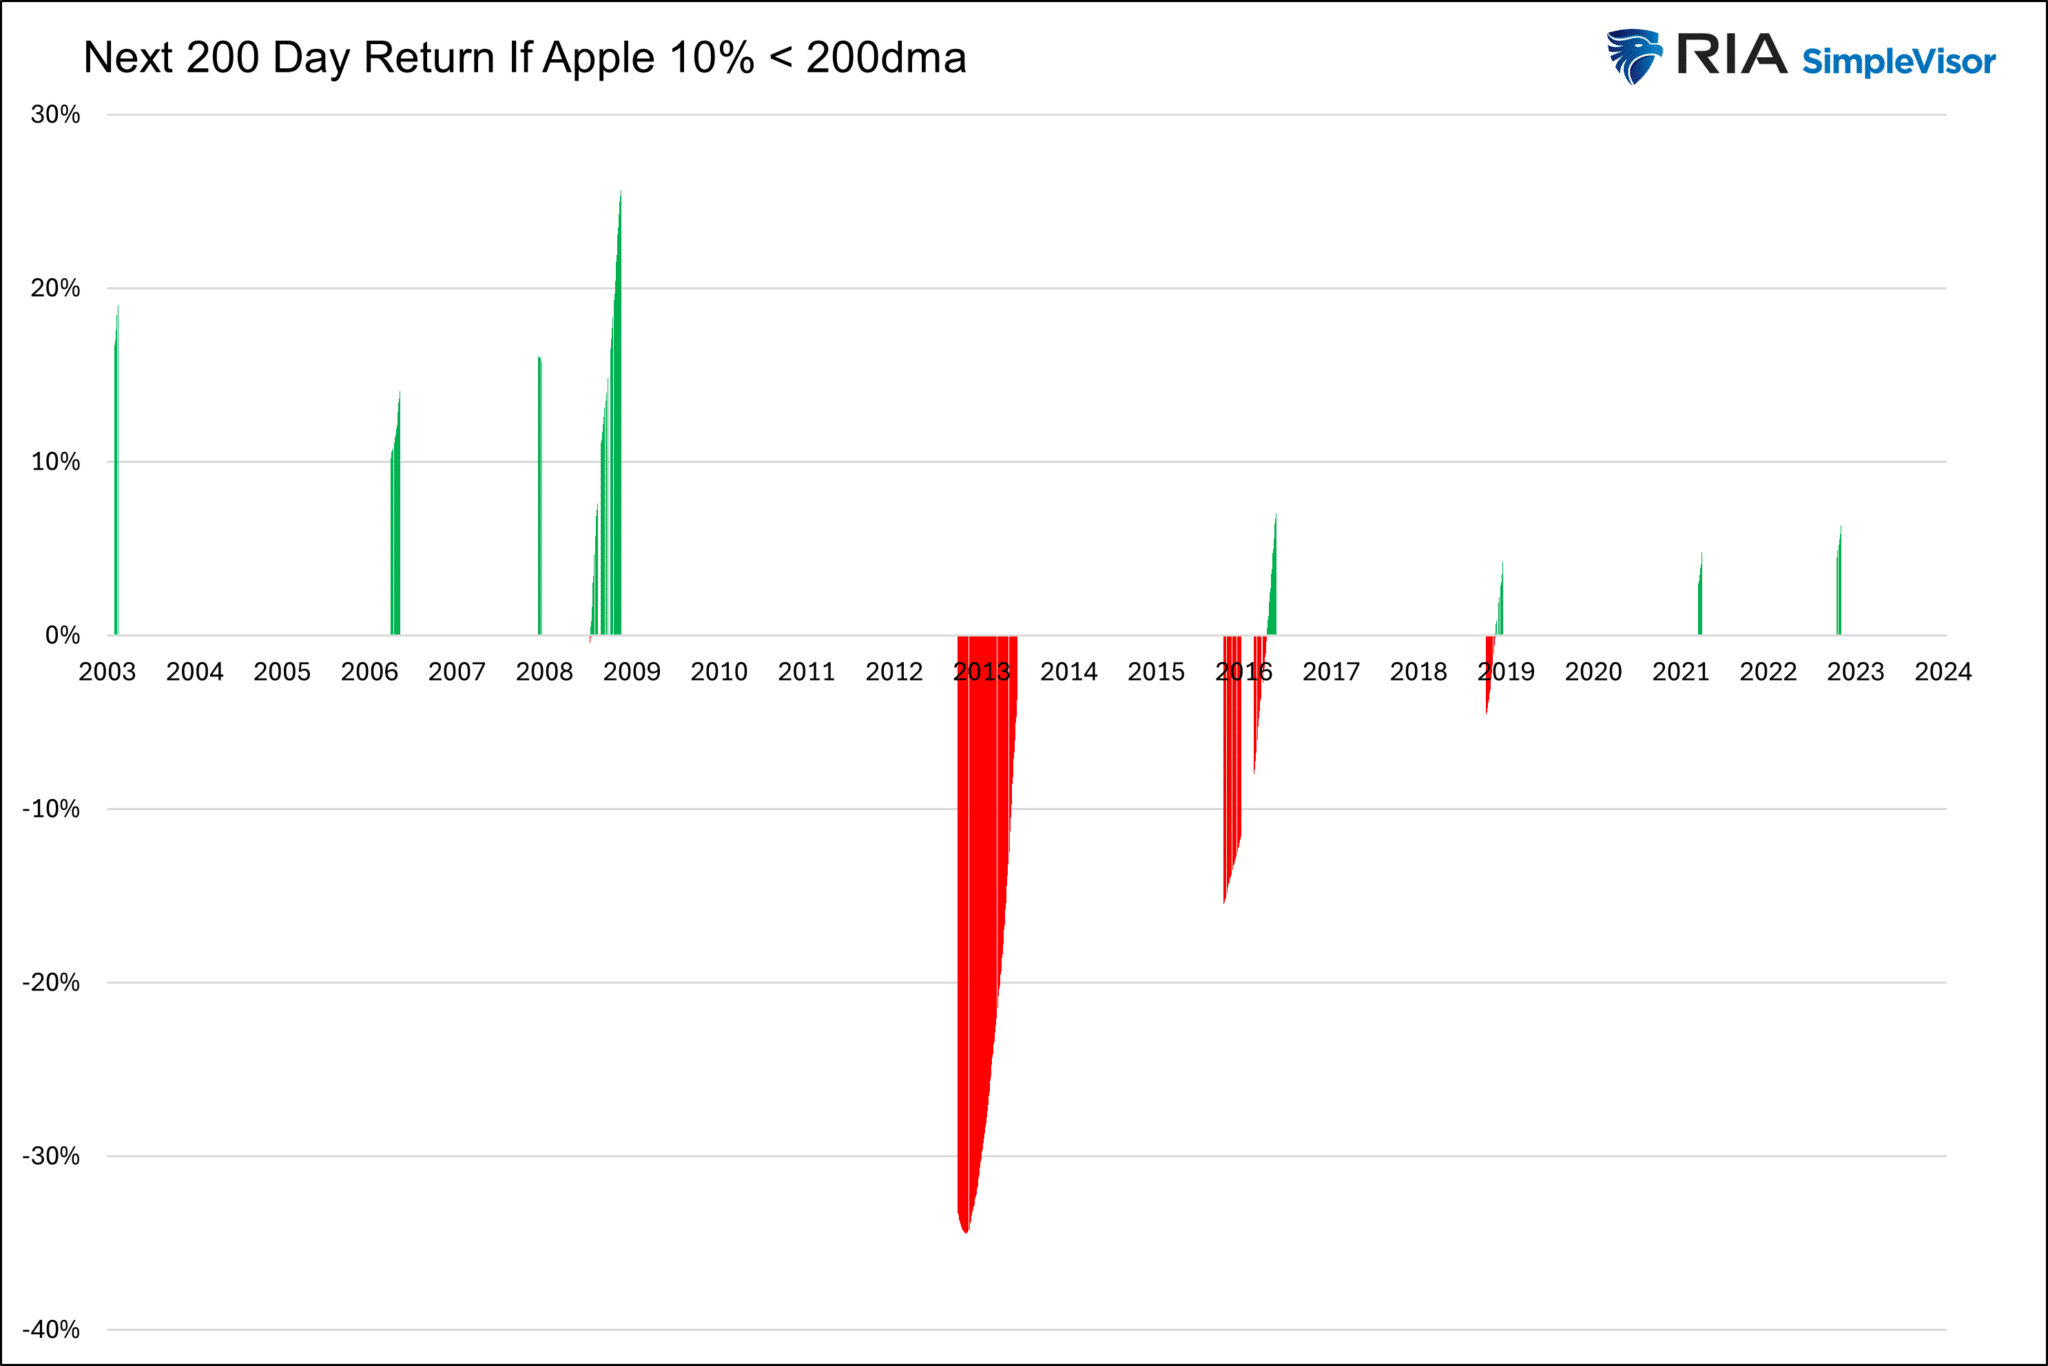
Apple shares have been floundering since mid-December despite the broader market trending higher. The year to date, the S&P 500 has been up by about 10%, yet its second largest contributor, Apple, has been down by nearly 8%. The first graph below charts the price ratio of Apple to SPY. The orange dotted line represents the ratio’s 200-day moving average, and the green line is the percentage difference between the ratio and the moving average. The ratio is currently about 20% below the moving average and on par with prior troughs. The second graph shows the ratio’s return for the next 200 days after it was 10% or more below its moving average. The top graph shows that deviations such as today are good buying opportunities. However, there are periods, such as 2013, when patience was required before the ratio turned upward.
If The Fed Is Done Hiking Bonds Look Tempting
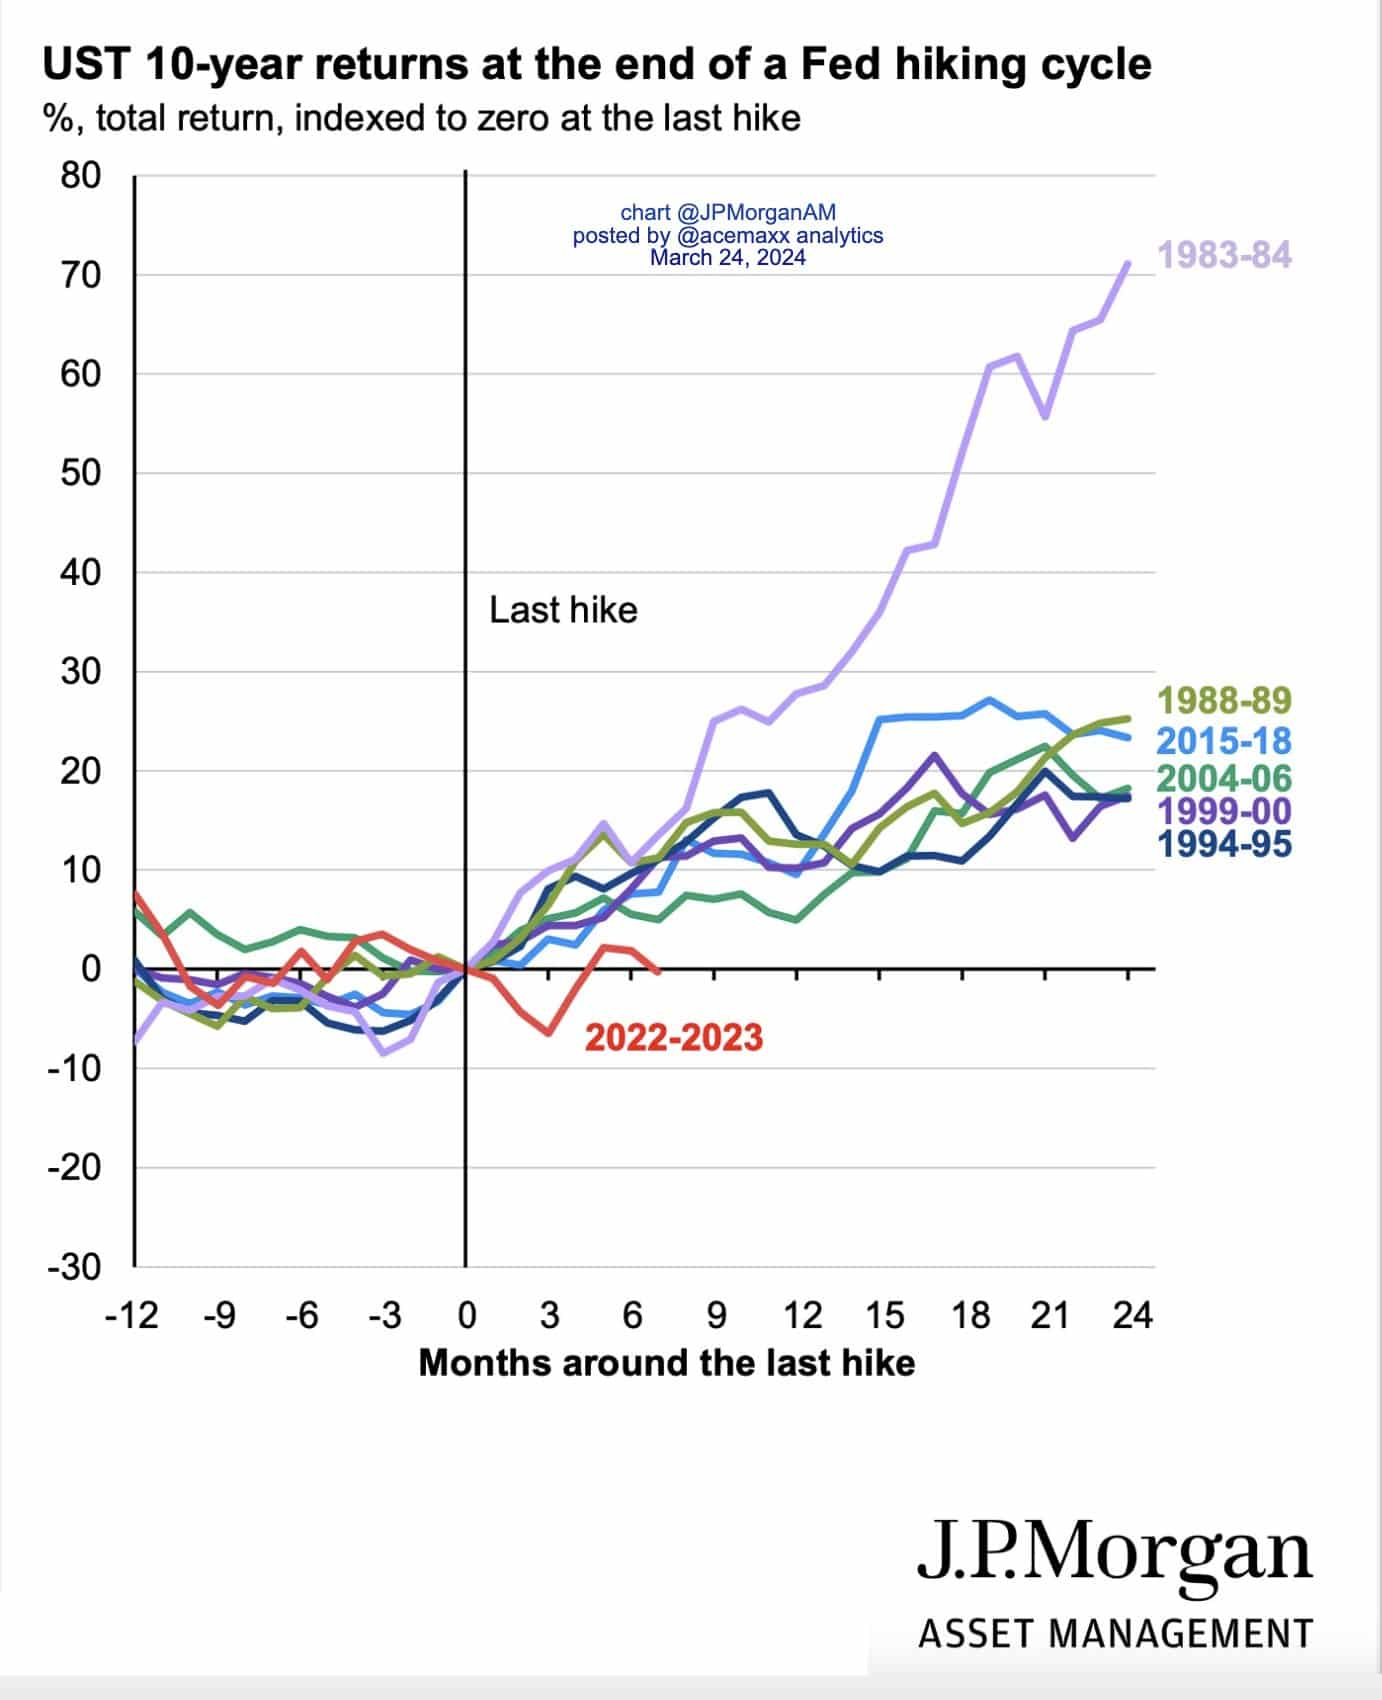
The graph below, courtesy of JP Morgan Asset Management, shows total bond returns each time the Fed ends a rate hiking cycle. Presuming the last hike was July 2023, recent bond returns are below average. Given the past few years’ inflation experience and its recent stickiness, investors may still worry that the Fed hasn’t hiked for the last time. However, if the rate hiking cycle is over, history shows that bonds offer tempting returns if inflation resumes its trend lower and the Fed starts cutting rates.
Tweet of the Day
“Want to have better long-term success in managing your portfolio? Here are our 15-trading rules for managing market risks.”