Written by: Steven Vannelli | Knowledge Leaders Capital
We find compelling evidence that seasonal factors exist, historically leading November and December to be the highest 2-month combined returns all year. In our allocation portfolios, we have increased our equity exposure significantly in an effort to capitalize on these year-end trends.
We looked at the S&P 500, S&P 600 and NASDAQ domestic indexes. We also considered the Stoxx600 as a proxy for Europe and the Nikkei 225 as a proxy for Japan, using returns data in local currency. We then dug into each of the sectors within the S&P 500 and S&P 600. Due to the lack of history, we excluded the real estate sector.
Of the major indexes, the best returns in November and December came in the following order: S&P 600 Small Cap (5.16%), Nikkei 225 (3.62%), S&P 500 (3.25%), Stoxx600 (3.11%).
Across all indexes considered, November was decidedly the better month compared to December as returns were higher in November than December. The smallest dispersion in November and December performance was the EuroStoxx 600 (23bps) but the S&P 600 Small Cap came in a close second (28bps).
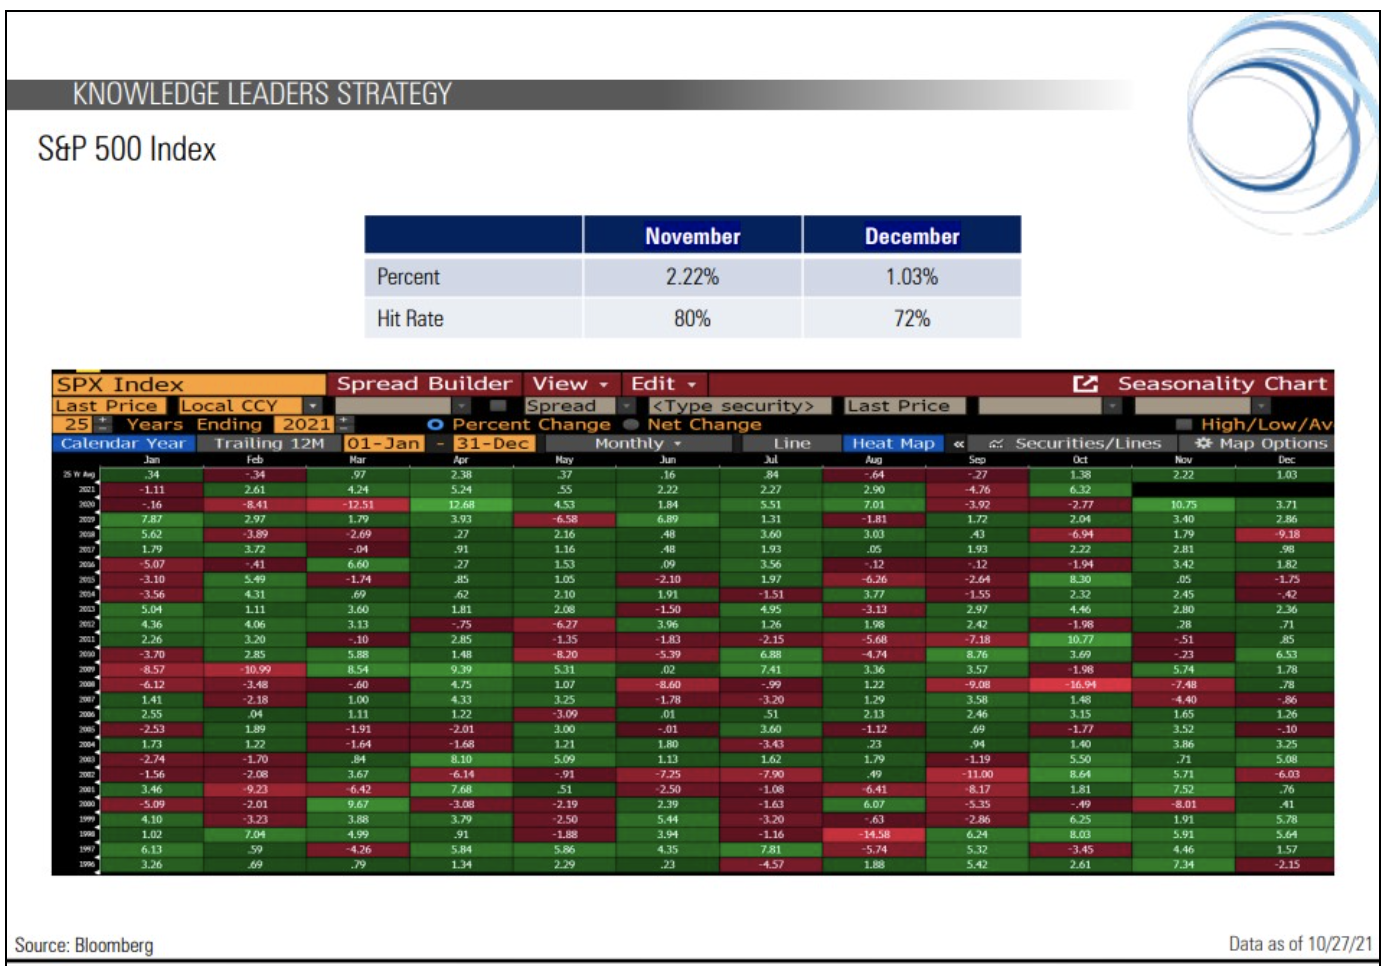
The highest “hit rate”—meaning percent of months of positive performance over the last 25 years—was a three-way tie at 80% among the S&P 500, S&P 600 and NASDAQ.
Next, we looked at the 25-year high and low for November and December. We then calculated the high/low ratio–a stat analogous to the overall capture ratio fund investors are used to analyzing–by dividing the highest month by the lowest month of the 25-year average. Here the results differed among the major indexes. The S&P 500, S&P 600 and Nikkei 225 had much higher hit rates in November than December. At the same time, the NASDAQ and Eurostoxx 600 experienced higher hit rates in December than November.
Among the S&P 500 sectors, the highest November and December combined return came from the late cyclical industrials (4.49%) and materials sectors (4.12%). The worst combined returns came from the utilities sector (1.5%).
The S&P 500 healthcare and industrials sectors were tied for the highest hit rate in November (88%). For December, the highest hit rate was the utilities sector (80%), and it was also the only sector to experience a higher hit rate in December than November.
Among S&P 600 sectors, the highest combined November/December return came from the healthcare sector (6.71%), with both technology and materials tied at 5.8% for second place. The worst performing sector was the energy sector, rising 2.58%.
The highest hit rate for November was a tie between the healthcare sector and industrials sector at 84%. The highest hit rate for December was the industrials sector at 80%.
We find US Treasury bonds, gold and oil are mostly unchanged in the final two months of the year.