

Trending

Written by: George Smith | LPL
The latest weekly sentiment survey data from the American Association of Individual Investors (AAII) released today shows a continued fading of investor bullishness, pulling back from levels that had been approaching extremes at the end of last year.
The mixed start to the year for stocks, with the S&P 500 down almost 2% at one point from its recent high, has brought some bearish individual investors out of hibernation. The scaling back of rate cut expectations by the Federal Reserve (Fed), the related 20 basis points (0.2%) jump in the 10-year Treasury yield, and heightened geopolitical risks may also have contributed to increased investor caution.
The percentage of individual investors who are bullish about short-term market expectations fell to around 40.4%, while the percentage of investors who are bearish rose to 26.8%. This puts the statistic that we follow most closely, the spread between the bulls and the bears, at 13.6%, down from 24.4% the prior week. This is still well above the 10-year average of 1.6%, but it has come back considerably from 32% at the end of 2023.
As noted in the chart below, investor sentiment, as measured by the spread between bulls and bears in the AAII survey data, has pulled back into a range we would consider average and a neutral indicator for stock return expectations. We generally examine investor sentiment survey data from a contrarian perspective, so when the indicator is near bullish extremes, it acts as a bearish signal for stock price returns, and when it's extremely bearish, the signal turns more support for stocks.
Investor Sentiment Eases Back Toward Average Levels
AAII Bull-Bear Spread, 10-year Rolling Average, and Rolling Standard Deviation Ranges
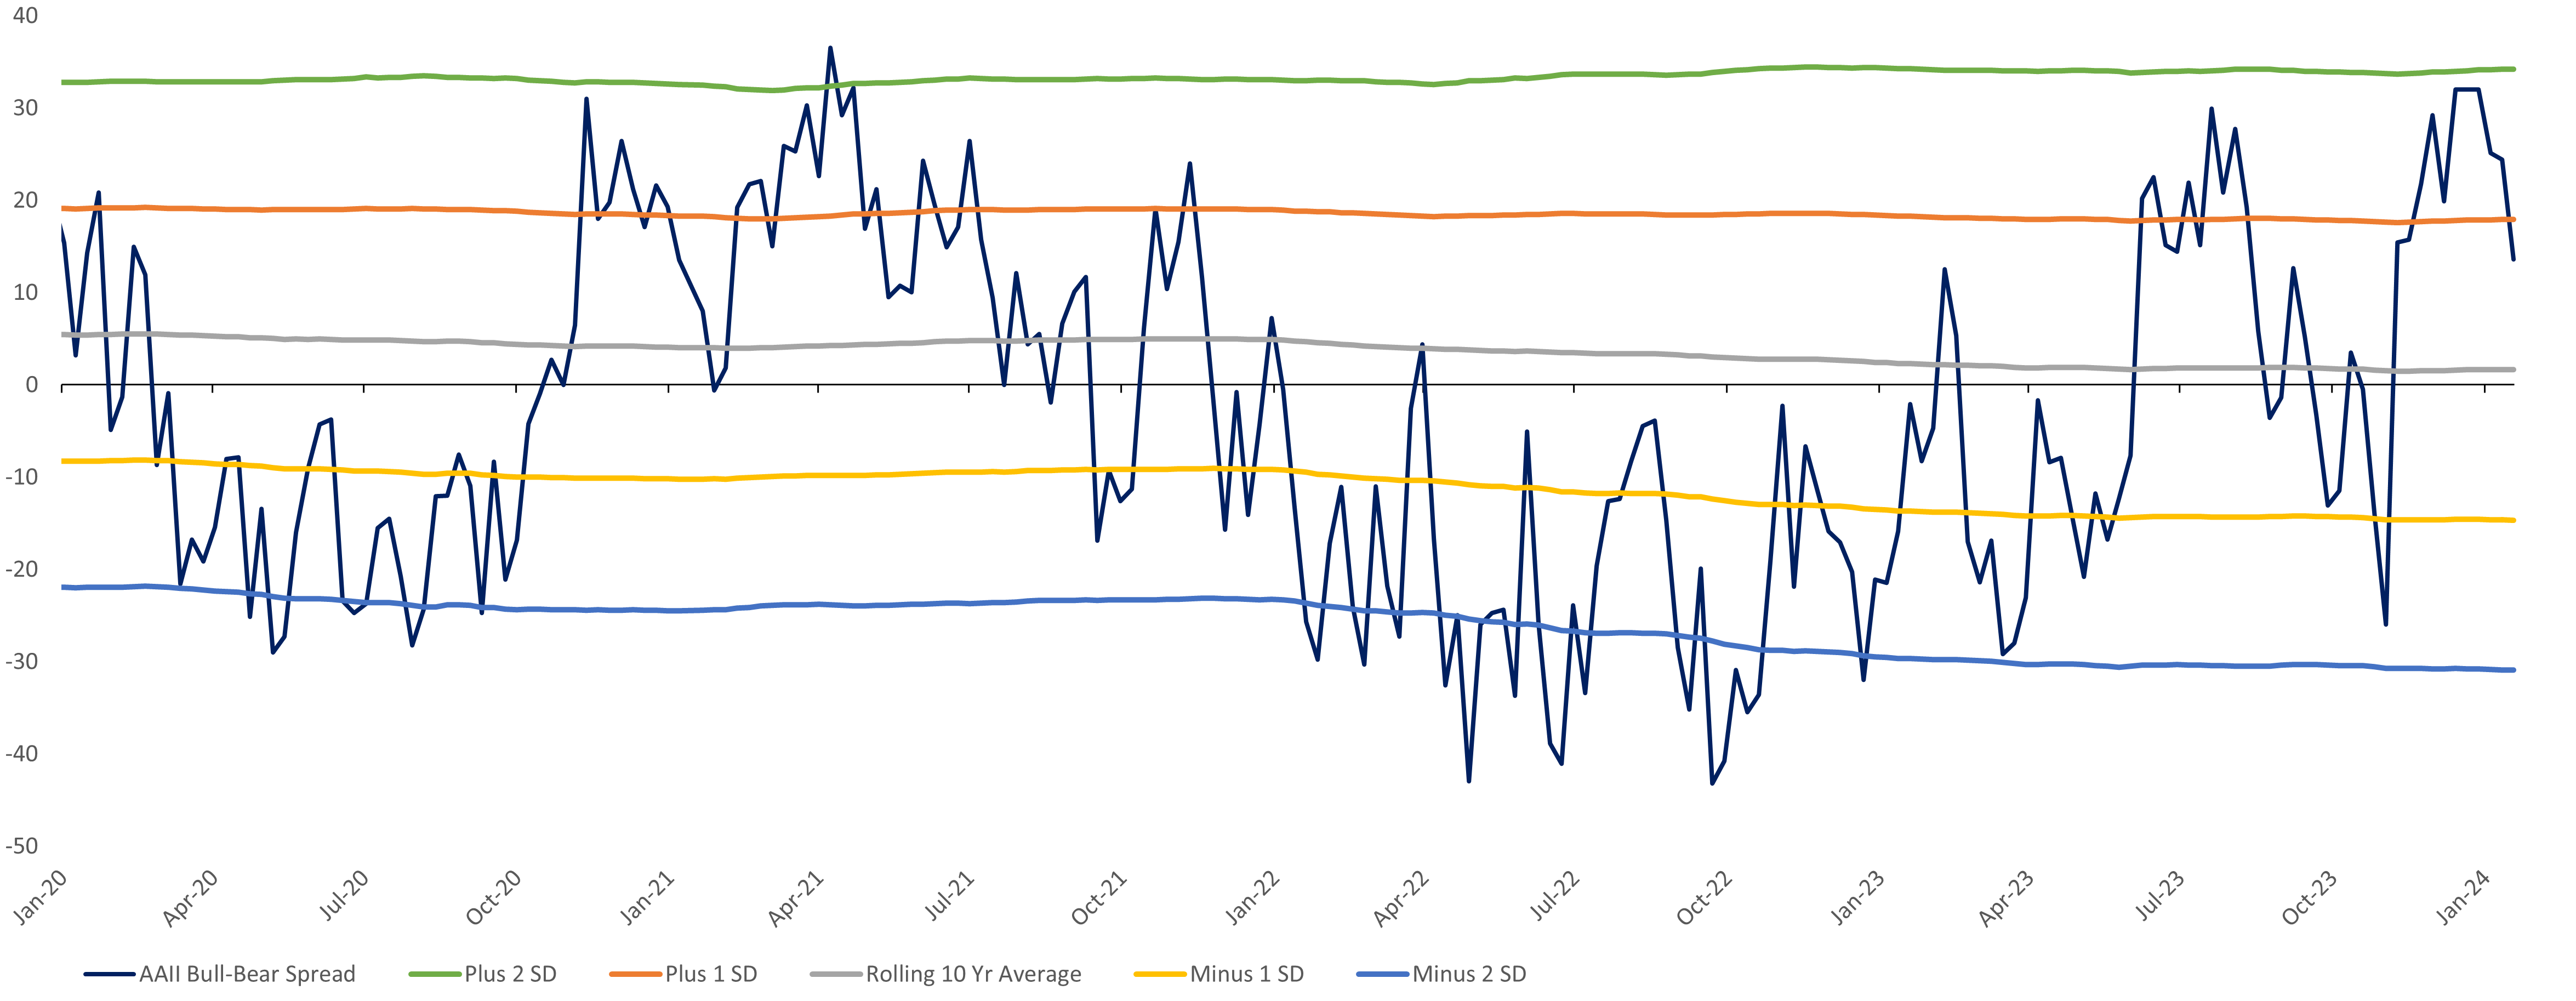
Source: LPL Research, Bloomberg, AAII 1/17/24
Disclosures: AAII bull-bear spread 10-year rolling average is 2% with a standard deviation of 16%. All indexes are unmanaged and cannot be invested in directly. Past performance is no guarantee of future results.
As illustrated below, historically, when the bull-bear spread has been at comparable levels of within one standard deviation from the average, S&P 500 returns have been very average as well.
Average Bullishness, Average Returns
AAII Bull-Bear Spread Bullishness and Average Forward S&P 500 Returns
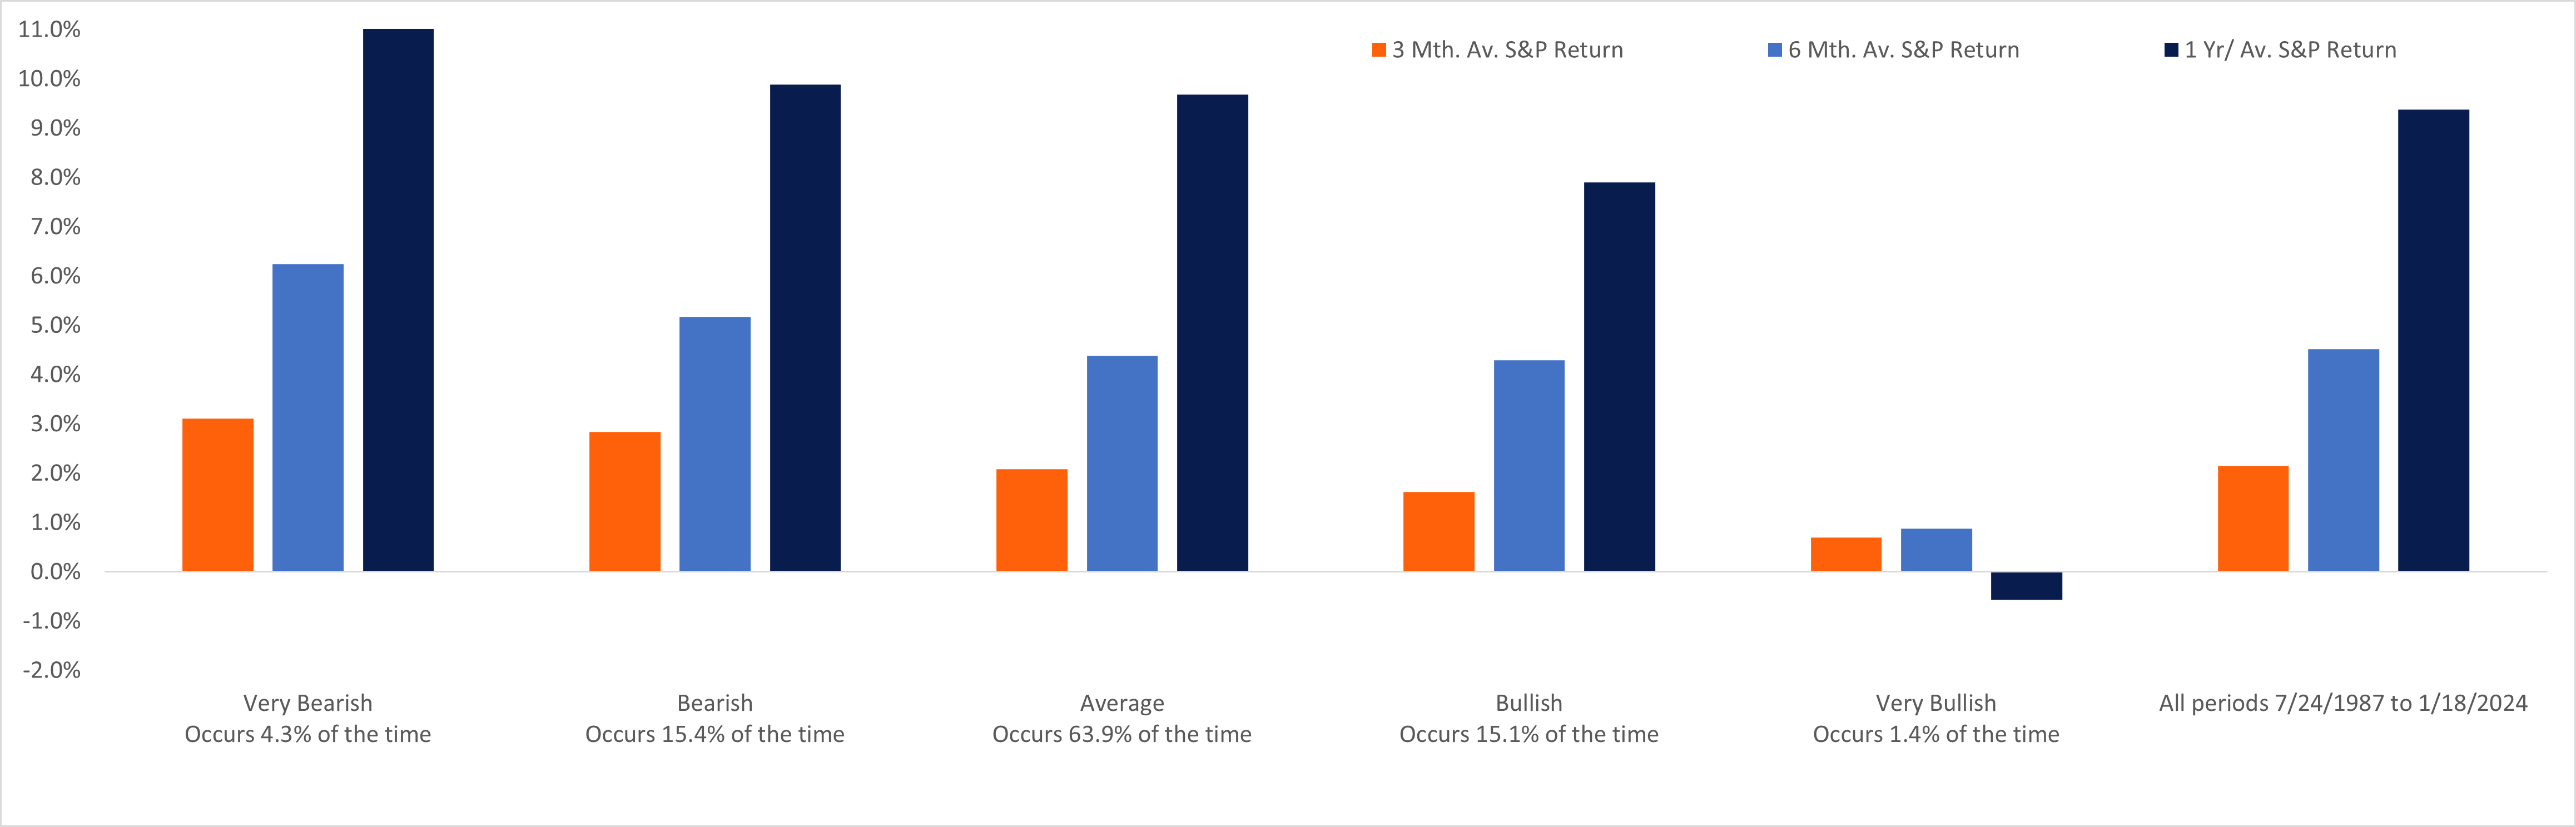
Source: LPL Research, Bloomberg, AAII 1/17/24
Disclosures: Bullishness categories based on AAII bull-bear spread one or two standard deviations above/below 10-year rolling average. 10-year rolling average bull-bear spread is 2% with a standard deviation of 16%. All indexes are unmanaged and cannot be invested in directly. Past performance is no guarantee of future results.
Another survey we study, the Bank of America (BofA) Global Fund Manager Survey, solicits the opinions of professional investors and appears much more bullish. The latest survey’s bull and bear indicator rose to 5.5, its highest level since November 2021. Another bullish answer to the survey revealed 79% of fund managers expect a soft-, or no-, landing for the economy, though in a slightly bearish move, average cash allocations did tick up (from two-year lows) in a sign some fund managers may be getting nervous at the current state of the markets.
Summary
The bullish mood that individual investors had coming into the end of 2023 has soured in the past few weeks, but we believe declines in sentiment, especially as it remains elevated for fund managers, are likely good for stock market investors. LPL’s Strategic and Tactical Asset Allocation Committee (STAAC) continues to recommend a neutral tactical allocation to equities, with a modest overweight to fixed income funded from cash. The slow start to 2024 for stocks has not only reined in some of the excessive individual investor sentiment survey data but has also helped reset historically overbought market conditions. Even so, the risk-reward trade-off between stocks and bonds still looks relatively balanced given higher yields and the potential for a slowdown in the economy. We continue to favor core bonds over cash, where the return profiles of short-term fixed income investments are attractive, but reinvestment risk remains.