
Trending

If we could only impart one bit of wisdom to our readers about today’s market it is “don’t fight the Fed.“
Unbeknownst to many investors, the saying, don’t fight the Fed, is a two-way street. It is easy for investors to grasp the advice when the Fed provides liquidity. During these periods of easy monetary policy, markets tend to grind higher daily. Volatility is low, meaningful declines are infrequent, and drawdowns tend to be shallow.
But, when the Fed raises rates and reduces liquidity, it’s wise to appreciate that the trend is not often an investor’s friend. In this scenario, don’t fight the Fed is a warning to take a more conservative stance.
Given the Fed’s current hawkish monetary policy agenda and its effect on asset prices, we thought it might be helpful to share our thoughts on Fed-based trend analysis.
The Fed Trend is Your Friend
The Federal Reserve provides markets liquidity directly and indirectly.
By purchasing or selling bonds, they affect the amount of investable dollars available to markets. They also provide liquidity directly to investors via the repo markets. Both actions directly affect the amount of money and securities in financial markets and, therefore, all financial asset prices.
Equally important is the Fed’s indirect impact on liquidity. The perception that the Fed is supporting or not supporting markets is potent. Investors usually feel more confident knowing the Fed is adding liquidity, regardless of how much liquidity finds its way to markets. Conversely, as we see now, angst tends to arise when they remove liquidity.
“Monetary policy is 98% talk.” – Ben Bernanke
Raising and lowering interest rates is another way they indirectly affect liquidity. Higher rates make it more costly to leverage financial assets and vice versa for lower rates. So-called margin trades increase the purchasing power of buyers.
Given the Fed’s direct and indirect influences, stocks often trend higher when the Fed is easing and fall when removing liquidity.
Trend Management
With an understanding of how the Fed influences markets, we need to consider the degree of “influence” they provide.
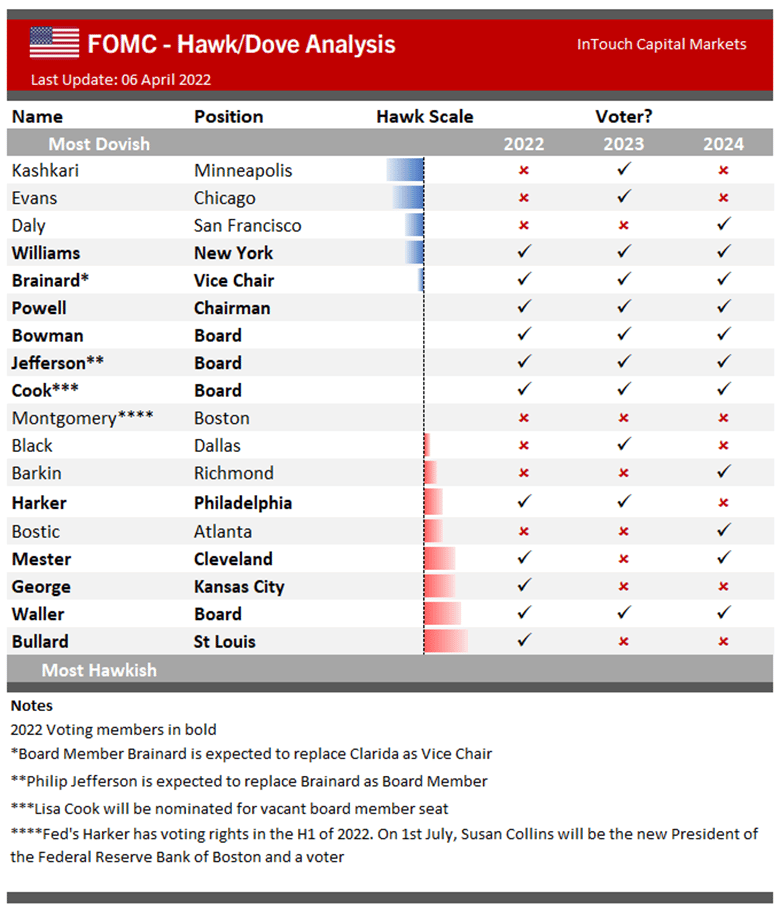
Financial media pundits often rate the Fed and its members on a hawkish-dovish scale. A hawkish plan is one in which Fed members want a tighter monetary policy to slow economic growth and or inflation. A dovish stance implies easier policy to support or boost growth and or prices.
The table below from InTouch Capital Markets is one such example. It is crucial to keep in mind the degree of hawkishness or dovishness is relative. For instance, Neel Kashkari is the most dovish member of the Fed today. Despite his dovish views, he is strongly advocating for a series of rate hikes and QT.
“Right now, it is easy to be a hawk because inflation is out of whack and the labor market is strong.”- Neel Kashkari
Reducing interest rates once or twice by .25% is far different from dropping them abruptly to zero percent and starting an extensive QE purchase program as we saw in 2020. The more the Fed alters monetary policy, the greater the market effect. And, importantly, the steeper the resulting market price trends.
Hawkish Dovish Slopes
Price trends tend to be the steepest, up, or down when monetary policy is most extreme. Today, monetary policy is potentially more hawkish than at any time in the last 30 years. The graph below provides hypothetical examples of varying price trends based on Fed policy. The current environment is akin to the Strong Hawkish yellow line. The Strong Dovish orange line represents the previous two years of extremely easy monetary policy.
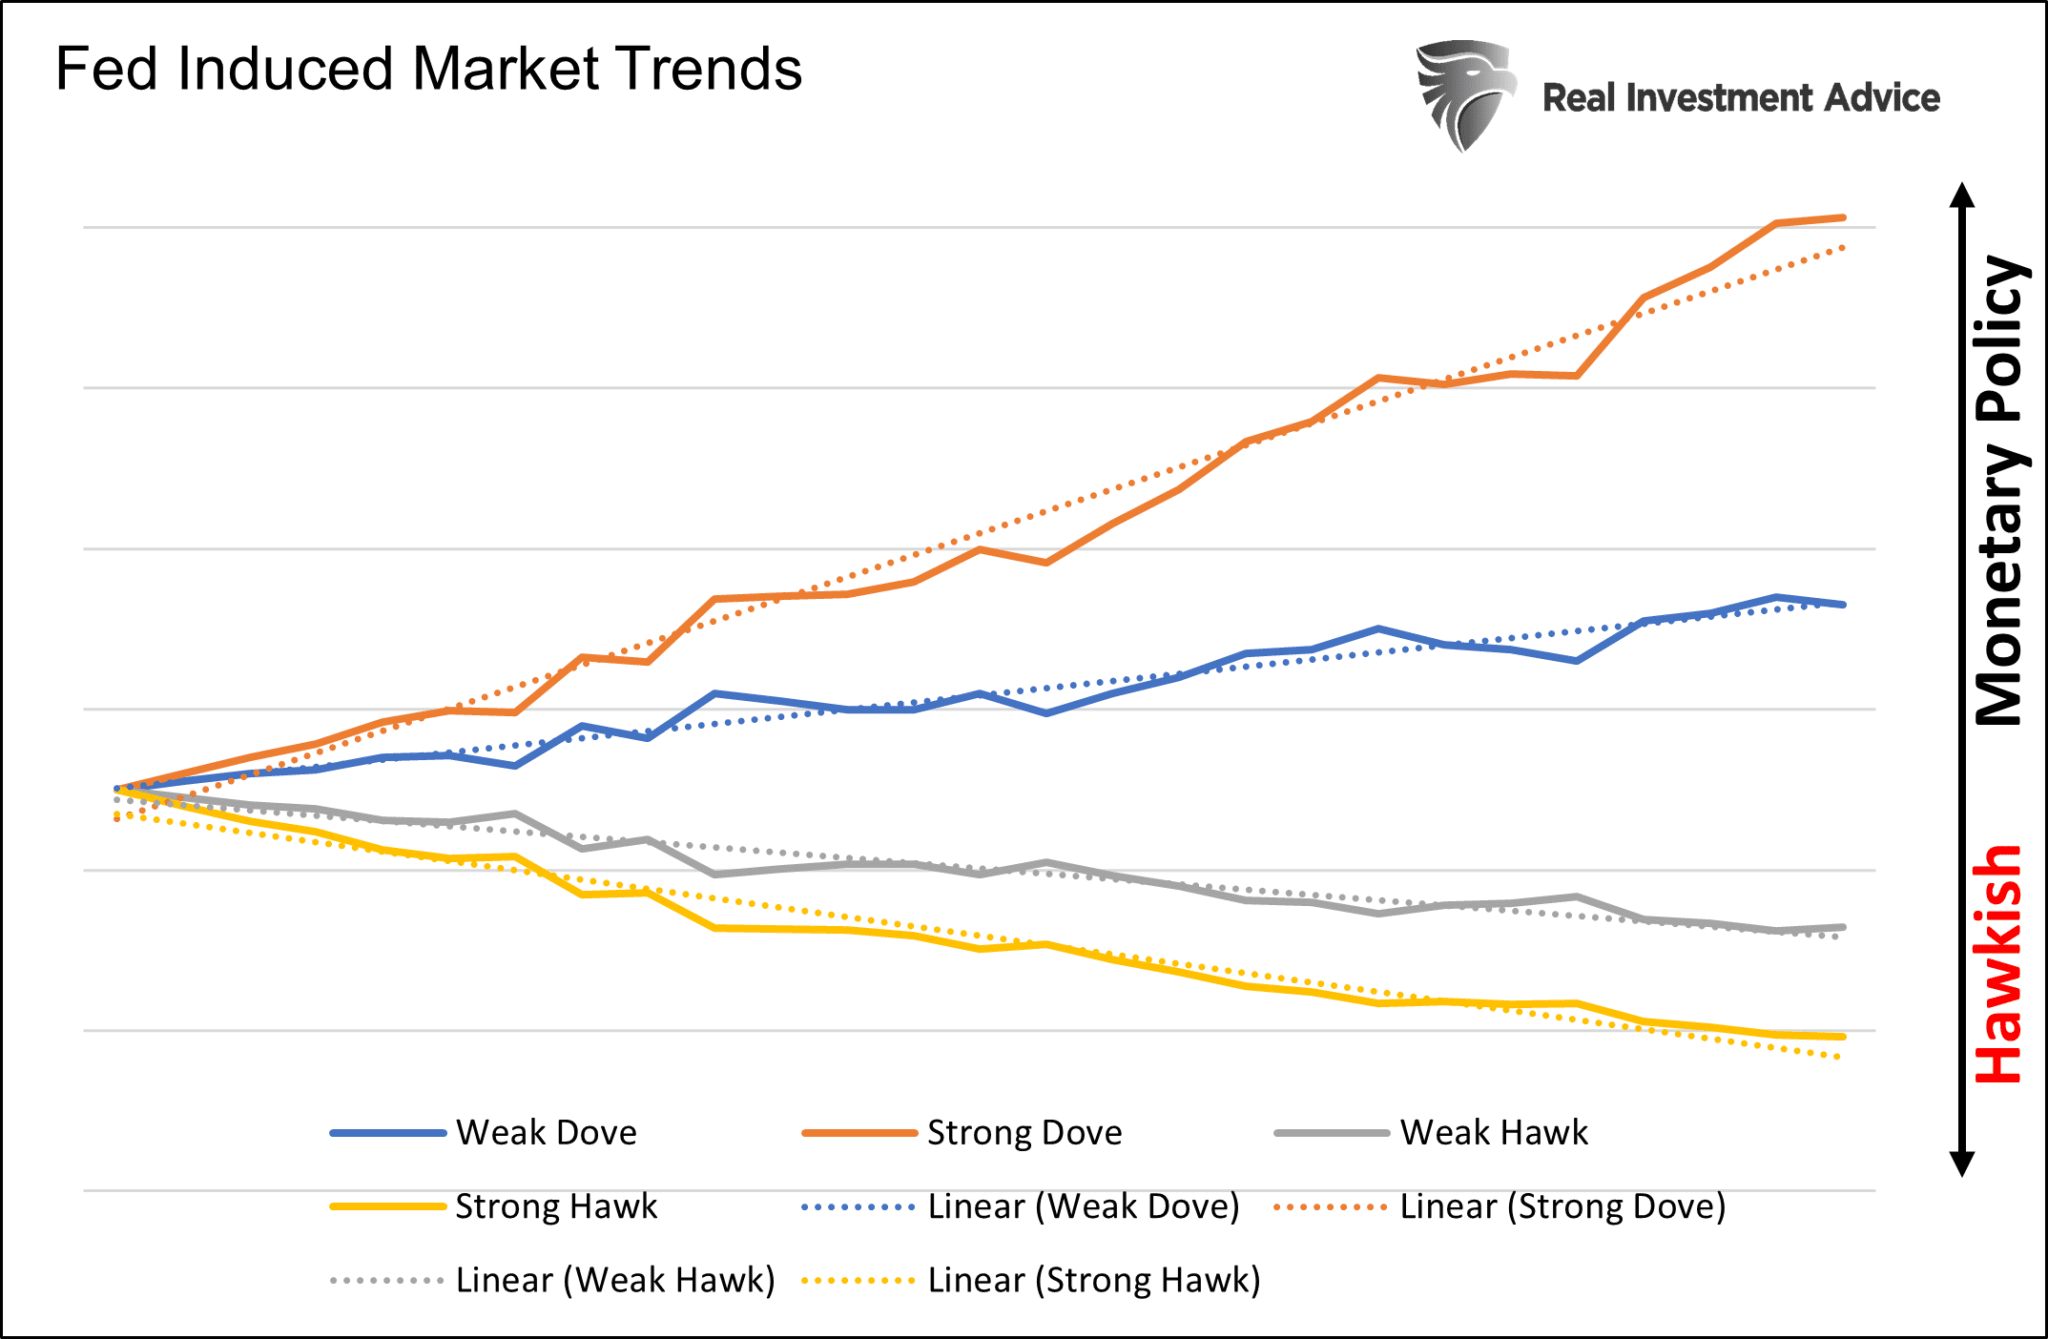
Analysis of the trend’s slope shifts with expectations for the Fed. For example, nine months ago, the upward trend started to flatten. At the time, inflation was rising rapidly, and the Fed began talking about interest rate hikes. Since the initial expectations were for small rate hikes and no QT, the trend flattening and ultimate shift toward a downward direction was gradual. Since then, the downward trend has steepened as Fed rhetoric has grown increasingly hawkish.
The slope of the trend will shift with expectations for monetary policy. Inflation, economic growth, and employment drive those expectations. If inflation starts fading quickly and economic growth continues to weaken, we suspect the Fed’s tone will be less hawkish. In such a scenario, the downward slope of the trend will become less steep.
At some point, the market will presume the Fed has tightened enough. Whether it’s a recession or much lower inflation, expectations for a change of policy stance will become more popular. Then a period of consolidation becomes likely. Expectations for QE and lower interest rates will likely follow, and the upward trend may resume.
S&P 500 2020-2022
Unfortunately, the trend analysis concept we discuss is abstract. While Fed-based trend analysis is helpful, it is impossible to quantify Fed dovishness and hawkishness into trend slopes. That said, understanding the slope and the trend can be a powerful risk management tool.
The graph below shows the changing trend channels of the S&P 500 over the last two years.
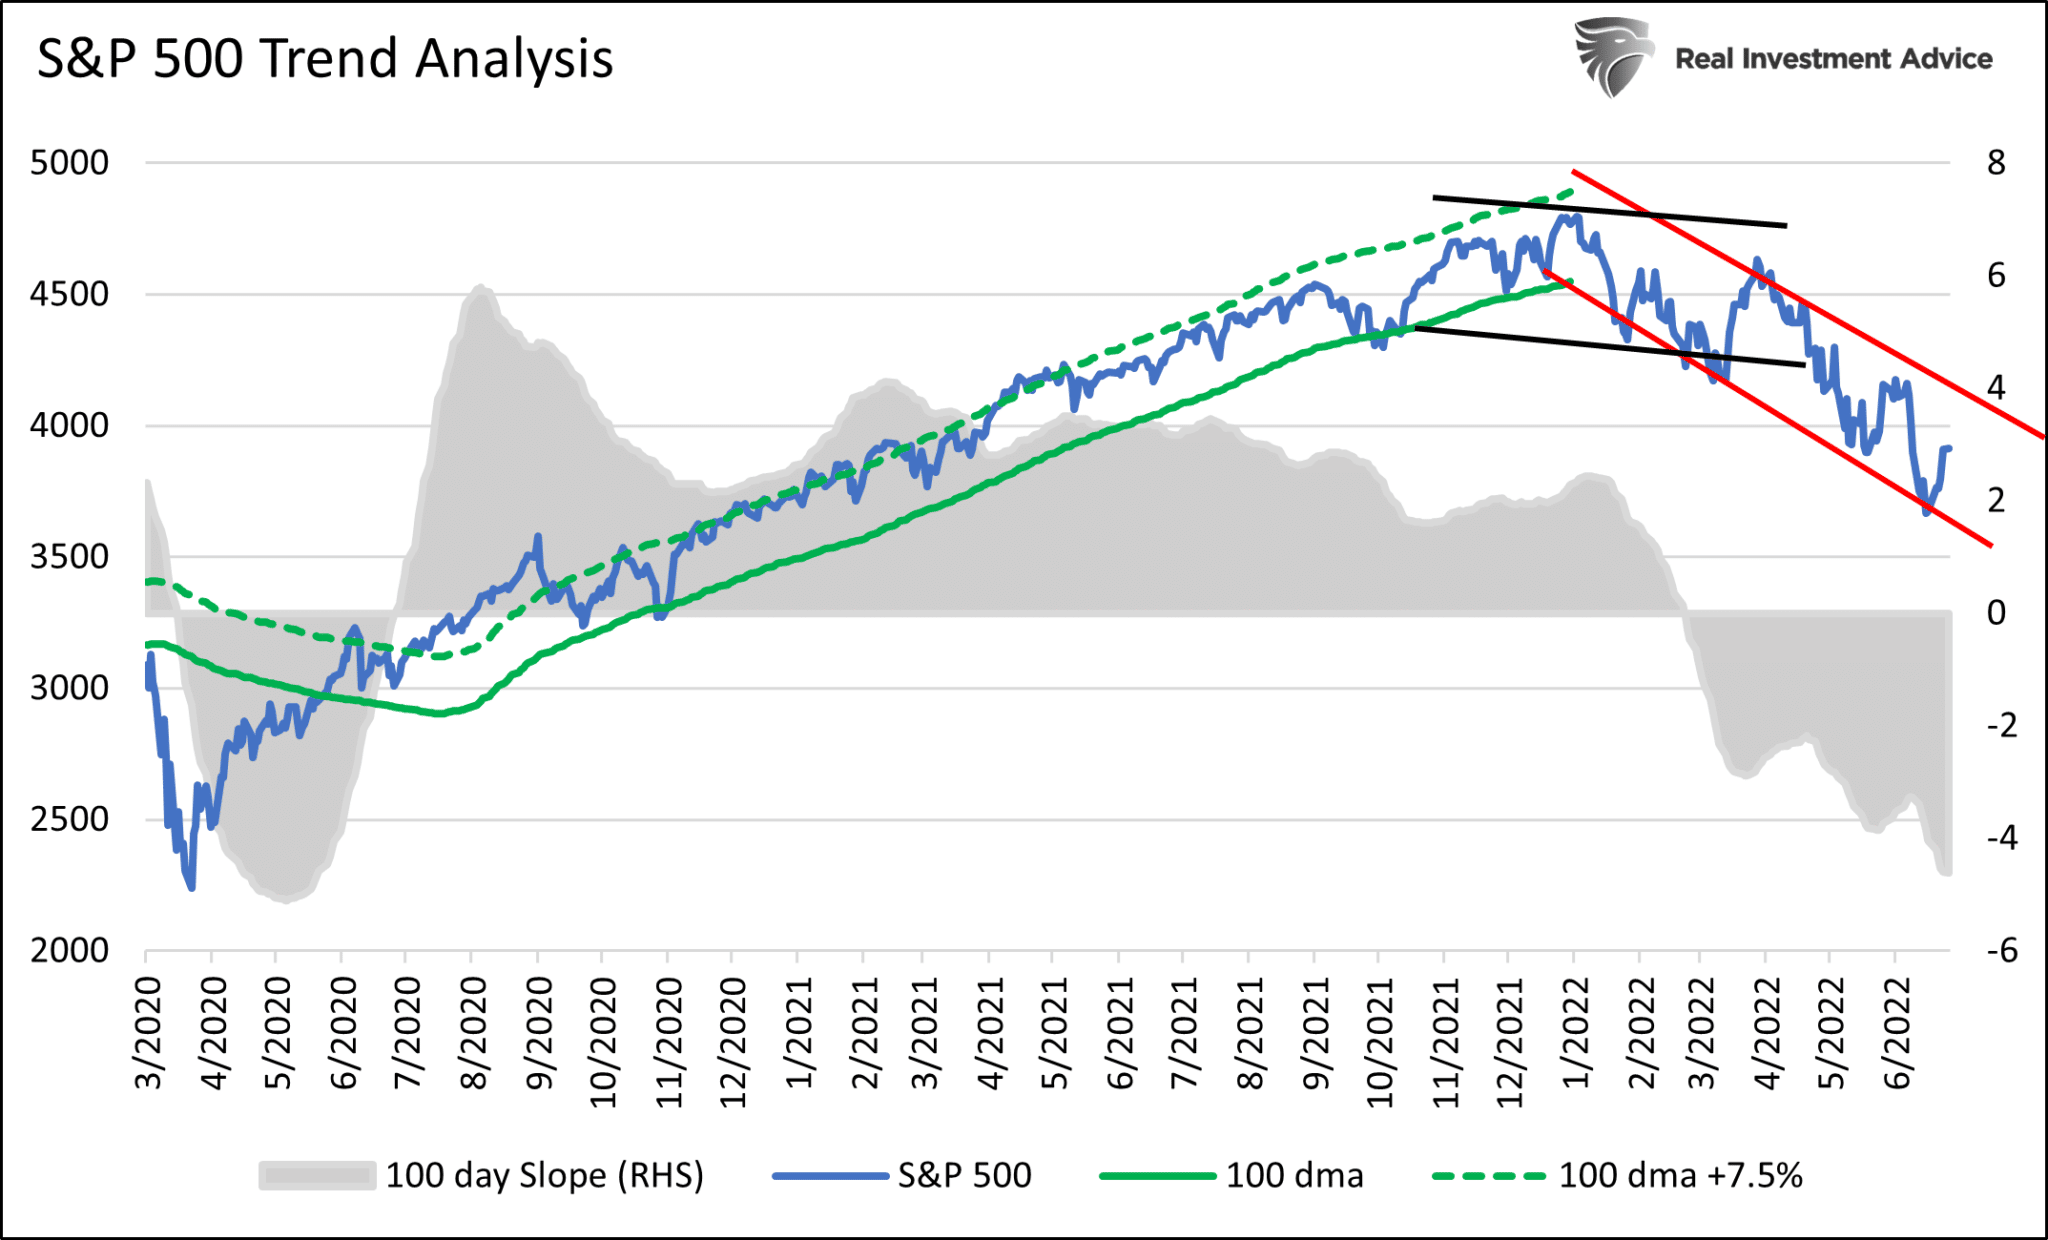
There are a few things worth pointing out in the graph.
- Between zero interest rates and unprecedented levels of QE, the Fed employed an exceptionally easy monetary policy from March 2020 until early 2022. As such, the trend higher was steep. The S&P 500 rose over 100% in less than two years!
- The upward trend was well defined, with support at the 100-day moving average (green) and resistance at 7.5% above the 100-day moving average (dotted green). Any breaks above or below the channel were opportunities to trade and rebalance.
- From September 2020 to June 2021, the S&P 500 closely tracked the upper green channel resistance.
- Around June 2021, investors started discussing the potential for a shift to a less dovish Fed stance. From that point, the S&P 500 started trading below resistance and occasionally touched support. The slope of the trend was flattening. We can see this as the trend pitch started declining (gray shaded area).
- As inflation rose beyond expectations and hawkish rhetoric became more common, the S&P started to consolidate (black channel).
- A new downward trend channel began in 2022 (red). As we see, the channel support is starting to establish itself.
The Fed is unlikely to become more hawkish than it is today. The question is, when do they start to pivot to a less hawkish policy. At that time, the slope of the red channel is likely to flatten, and a bottoming process can begin.
Summary
The Fed has just started its tightening campaign. Rates have risen on three occasions by a total of 150bps. Fed Funds futures imply another 2% of rate hikes by the end of 2022.
The current equity trend is sloping steeply downward. It will likely stay that way until the market thinks the Fed is letting up. At times prices will deviate toward the bottom of the channel and other times towards the top. Trading within the channel can be a valuable bear market trading tool.
Don’t fight the Fed and short stocks when the Fed is providing liquidity. Equally important and pertinent to today, don’t fight the Fed by aggressively buying stocks when the Fed is pulling liquidity from markets.