

Trending

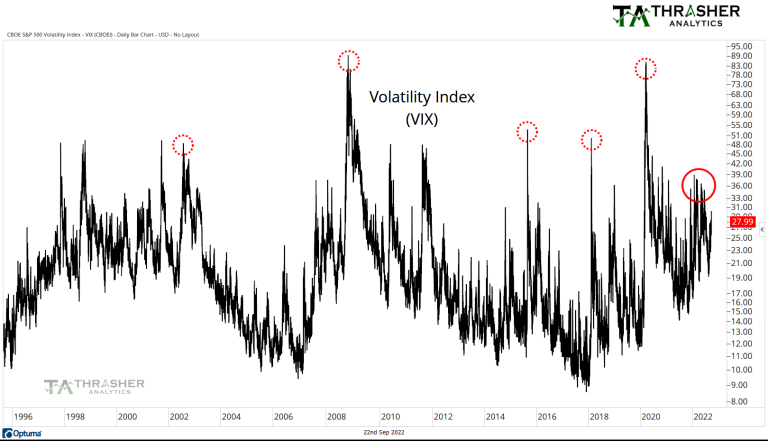
2022 has been a very volatile year despite what the Volatility Index may show. This has caused many active investors and traders a great deal of frustration as they attempt to set their sights on a spike in the VIX to signal the “all clear” that the bear market has ended. This belief that the VIX must spike to mark a bottom has established as a criterion due to its common occurrence during most declines in stocks. However, like all market axioms, it’s not a requirement and market will do as it pleases to cause the most frustration possible! Charlie Bilello put out a great table showing that the S&P 500 has declined between 1% and 2% 29 times this year, the most since the Financial Crisis in 2008. The high number of daily swings that exceed 1% in both directions is a common characteristic of a bear market and is a development that we need to see end in order most likely to entice buyers to regain control of the tape in any meaningful fashion.
The spot VIX chart, shown below, hasn’t gotten above 40 during the current down trend – leaving many investors scratching their heads. Over the last decade readings in the 40s and even 50s were common markers of equity lows – or approaching low. The market this year has been more “orderly” but not without its fair share of daily volatility. The caveat being that daily volatility has come in both directions which is likely what’s helped keep a proverbial lid on the Volatility Index.
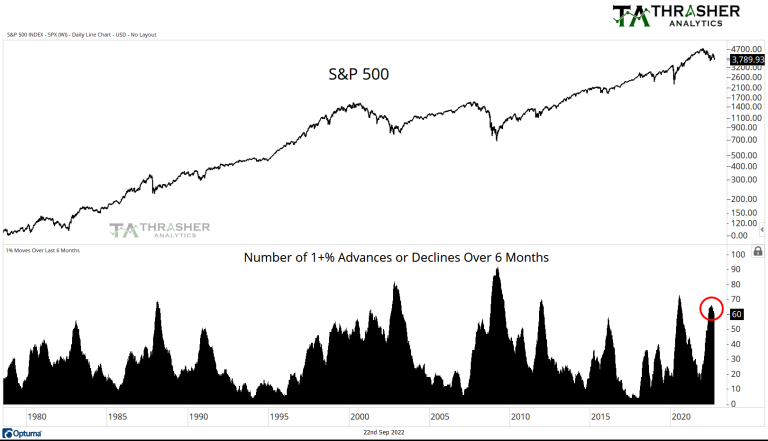
Below is a look at the number of days over the last 6-months we’ve seen the S&P 500 index advance or decline by 1+%. As of Weds., we’ve had 60 +/-1% days. This rolling figure peaked in July at 66, the most since the Covid Crash and before that, 2012 and 2009. Following the Financial Crisis we had over 90 days of +/-1% moves and in 2002 it peaked at 82 days. As we can see on the chart below, we’ve had an increase in daily volaltity, since it hasn’t occurred as a string of large down days – which would be like fuel for the VIX – the Volatility Index has not had a chance to experience a midlife crisis and instead has spent most of 2022 enjoying its 20s and 30s.
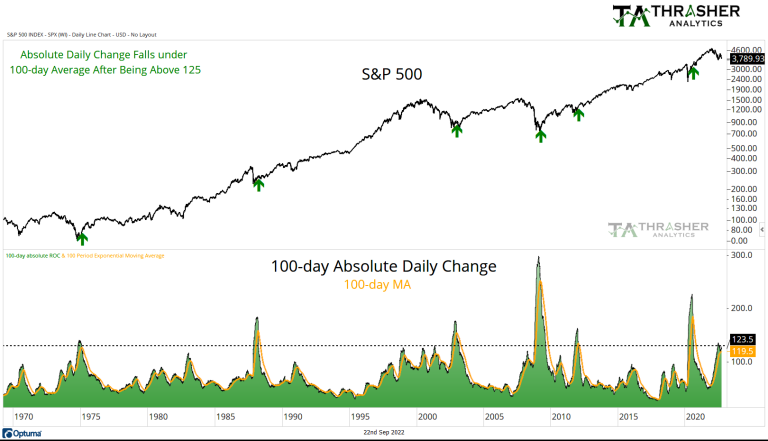
Rather than have tunnel vision on the absolute level of the spot VIX, I focus on the actual volaltity of the equity market as well. A concept that I believe was popularized by Ned Davis Research involves monitoring the 100-day cumulative absolute daily change as a gauge of market volatility. This is plotted on the chart below, along with the 100-day average of this data set. Since the 1970s, a common marker of markets shifting from bear to bull market has been a calming of daily activity. Market declines during this 50 year period all saw the cumulative total of daily change fall from a high of over 125 to under the intermediate average.
Historically, we haven’t seen a decline the size we’re experiencing today end without an end also to large daily moves. Fewer daily swings allow investors to wade back into the waters, no longer fearful of being smashed by a wave of volaltity. Currently, we’ve seen the cumulative 100-day total peak above 125 but it’s yet to cross under the intermediate average. We’re close! …But not there yet. I’ll be watching, and sharing in my weekly Thrasher Analytics letter, how this chart develops and when we begin seeing calmer waters develop.
Related: Bond Spreads Are Widening