Written by: Matt Berger, CIMA®
Investors have poured more money into cash than any other time in history, even while the markets have rebounded.1 Cash may feel safe, but research shows the real long-term risk with stocks is not owning them.
In my last article, we covered the ongoing historic peak in cash holdings — and the big price tag investors are paying in lost opportunities when they miss out on long-term growth. In this article, I'd like to share some encouraging discussions you can have with apprehensive clients, backed by research.
Cash vs. stocks: There is a clear long-term difference
Cash can play a crucial role in every portfolio — especially when it comes to funding for short-term goals and liquidity needs.
However, when investors make the decision — often based on fear or gut instinct — to hold their long-term assets in cash instead of investing in stocks (or a balanced portfolio), let's not mince words: they’re making an active bet (even if they're just paralyzed by inaction). And if you look at the odds, it's a bet they're likely to lose. Cash simply doesn't offer the long-term upside that growth opportunities with stocks do.
The proof is in the math
We analyzed rolling periods, ranging from one to 25 years, going back to 1940 to specifically identify just how often cash underperformed stocks.2
You're probably not surprised to learn that over long periods of time like 15, 20 and 25 years, stocks came out on top almost 100% of the time.
But even over one-year periods, cash historically lost to stocks more than 70% of the time.
Another useful comparison is to consider by how much, on average, stocks outperformed cash (which they did for every timeframe).
Over one year, cash underperformed by 9% — that might put a small dent in your portfolio, but most investors can recover from it. But if you held cash for three years, that number goes up to 31%. Hopefully you don’t know of any investors who have held a large chunk of cash for 25 years, but if they did, their average underperformance would have been an eye-popping 1,214%!
Even if cash might feel safe right now, these numbers help to show that the real risk when it comes to stocks — especially over long periods of time — is not owning them.
The Cash Conundrum — an important conversation with cautious clients
Are your clients holding too much cash? Use our clear, simple, fact-based brochure to help them better understand the problems that can come with what they think is a “safe” investment. Contact your Lincoln representative for a personalized walk-through of this and other client-approved materials.
The media is not the market
It's so easy to come up with reasons not to invest. Just open a newspaper — or if you want your news with even more bells and whistles, turned up to 11, turn on the television or radio.
But the media-driven headlines are not the market (even if they really feel like they are!). Over the long term, they may have much less influence than we might imagine. Consider a few past headline events, and how an investor would have fared had they simply stayed the course in stocks.3
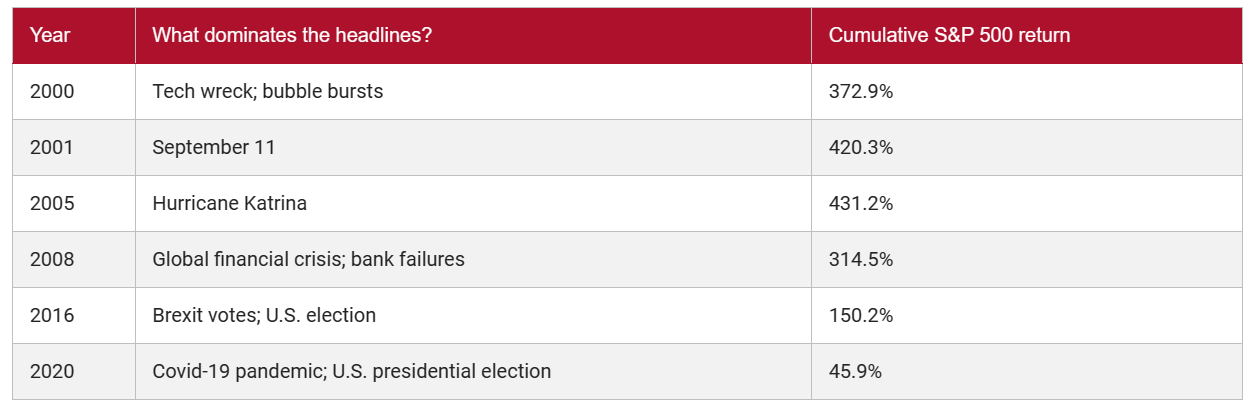
Although it sure didn't feel like the time was right to invest in the moment, when we look at the facts, and not the drama, a different picture emerges.
The math shows that it’s always a good time to invest
Even if you invest on the worst possible day of every year, you can still achieve strong results over the long-term. Consider the numbers if you invested $12,000 every year from January 2000 to June 20234:
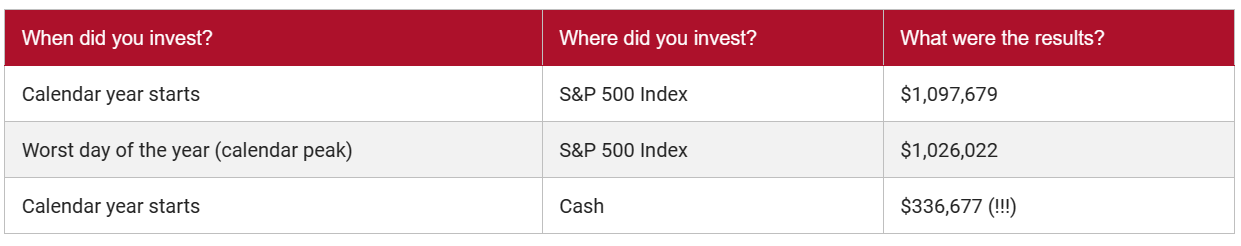
It's shocking to see that, even if you invested on the worst day every year, you still ended up with nearly the same amount as if you invested at the calendar start. However, those who invested in cash perpetually waiting for a “better” entry point were left behind.
And the economy is certainly not the market!
How long has the media been warning about the looming recession — you know, the one that is just over the horizon, ready to fall on us at any minute?
Well, markets tend to be forward-looking. This means that what we see in the economy today has generally already been priced into financial markets. Furthermore, the official start and end of recessions generally aren't telegraphed — their timing is often declared in retrospect.
On average, stocks peak seven months before recessions begin, and start recovering six months before recessions end.5 Looking at the economy to make investment decisions is like looking at the rearview mirror while driving forwards.
Once again, the proof is in the math
How well would an investor have done in the S&P 500 if they tried to time recessions, over the period from 1940 to 2022?6
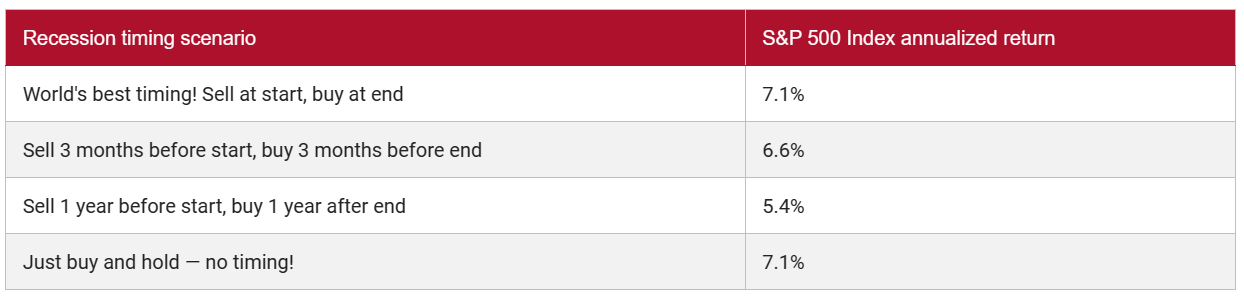
So if you have a crystal ball on the economy, you can try your hand at timing your exit and entry into the market around recessions. Or you can invest for the long term, and probably end up with similar results.
The sidelines can be a lonely place. Help investors get their head back in the game.
I noted this in my last article, but it's worth saying again: The things that really build wealth are time, growth potential, tax efficiencies and commitment (and sometimes this shows up as courage). Here are some tools to help you have this crucial discussion with clients:
- The Cash Conundrum client-approved brochure
- The Cash Conundrum client-approved presentation
- Your dedicated Lincoln wholesaler can walk you through these materials and supply you with tools and tips to reach out to your clients.
If you have clients who are overweight cash — or concerned about the markets — please contact your Lincoln representative today. Follow us on LinkedIn for regular insights and tips on timely financial topics.
To read other blog content like this, visit Lincoln's informed financial professional blog.
Related: Financial Solutions for Your Family’s Situation
1 AllianzLife.com, 2023. Most Americans Say They Can’t Count on Social Security for Retirement Income.
2 NYU.edu, Lincoln Financial Group. Rolling periods with a 1-year step S&P 500 vs. cash. Cash proxy = average 3-month Treasury Bill rate in each calendar year.
3 J.P. Morgan Private Bank for events. Cumulative total returns for S&P 500 are calculated from December 31 of the year prior to June 30, 2023, sourced from Morningstar.
4 Bloomberg, Federal Reserve Bank of St Louis, Lincoln Financial Group as of June 30, 2023. S&P 500 total return index used. 3-month U.S. Treasury Bill used as a proxy for cash investment.
5 Capital Group, Federal Reserve Board, Haver Analytics, National Bureau of Economic Research (NBER), RIMES, Standard and Poor’s. Data reflects the average of completed cycles in the U.S. from 1950 to 2021.
6 Bloomberg, Federal Reserve Bank of St. Louis, Lincoln Financial Group. S&P 500 Price Return index from 1940-2022. Does not include dividends.
The views expressed are those of Matt Berger, Vice President of Client Investment Strategies for Lincoln Financial Group and not necessarily of any Lincoln Financial Group® affiliate or the broker-dealer. Neither the information or views expressed are based on any particular financial situation, or need, and are not intended to be, and should not be construed as, a forecast of future events, research, a guarantee of future results or investment advice or a recommendation for any specific strategy, product or service.
Lincoln Financial Group® affiliates, their distributors, and their respective employees, representatives and/or insurance agents do not provide tax, accounting or legal advice. Please consult an independent professional as to any tax, accounting or legal statements made herein.
Lincoln Financial Group is the marketing name for Lincoln National Corporation and its affiliates, including broker-dealer/distributor Lincoln Financial Distributors, Inc., Radnor, PA, and insurance company affiliates The Lincoln National Life Insurance Company, Fort Wayne, IN, and Lincoln Life & Annuity Company of New York, Syracuse, NY. Affiliates are separately responsible for their own financial and contractual obligations.