
[An intriguing article with a very different perspective and an automated AI methodology for fundamental analysis was recently contributed to the Institute. We are happy to have guest financial services innovators contribute and share their thoughts and experiences on topics important to our financial services readers.
This investment report was contributed by Reginald Nosegbe, founder and CEO of Valspresso, the originator of the patented and proprietary methodology described in this article, along with Ty Seddon, a data science expert with 25 years artificial intelligence and algorithm development experience and Bob Caspe, 50 years of experience in technology and entrepreneurship.
Based upon more than 10 years of research and analysis of the equity market, we are happy to share their provocative views on traditional investment methodologies and processes.]
The Predictive Value of Fundamental Analysis
By Reginald Nosegbe, Ty Seddon, Bob Caspe
In this research note, we ask and answer the question: can automated fundamental analysis of GAAP financial statements be used as a basis for creating winning portfolios?
Summary
The financial statements of publicly traded companies are available to all market participants. It is a common belief that because everyone has this information and can incorporate it into their decision-making process, this information cannot be used to outperform the market. It is also a common belief that financial statements, which are by their nature backward looking, cannot be used to make predictions about the future.
Valspresso challenges these two common beliefs. Firstly, given the rise of quantitative trading and high frequency trading that primarily (or solely) considers price movements, fundamental analysis is not incorporated into market decisions as much as is widely believed. Secondly, the financial health of a company does have predictive value about the future health (and stock price) of a company since the current health of a company this quarter is a starting point for the success of the company in the next quarter. While there are many anecdotes of companies that may be exceptions, we have found that, in aggregate, there is significant predictive value in fundamental analysis, especially when that analysis is automated, timely, and thorough, removing human biases from the process. Given that this predictive value manifests itself in the aggregate (i.e., it is probabilistic), it can be effectively applied to systematic investment portfolios, where improving the overall performance while reducing risk is the objective.
Methodology
To perform automated fundamental analysis, our methodology analyzes companies along three categories of fundamental health:
- Profitability - Is the company making money from its business?
- Liquidity - Can the company pay its bills without borrowing?
- Capital Structure - Is the company structured to reward investors?
Using an automated in-depth accounting analysis of each company’s most recently reported 10K, 10Q and 8K data, our methodology assigns Risk-managed Fundamental Grade (RFG) to companies, ranging from “A” to “F”, with incomplete data assigned “I”. A company’s risk-managed fundamental grade is calculated each time a new financial statement is filed with the SEC. The calculated fundamental grade is associated with the corresponding trading days when that financial information was known to the public.
Performance
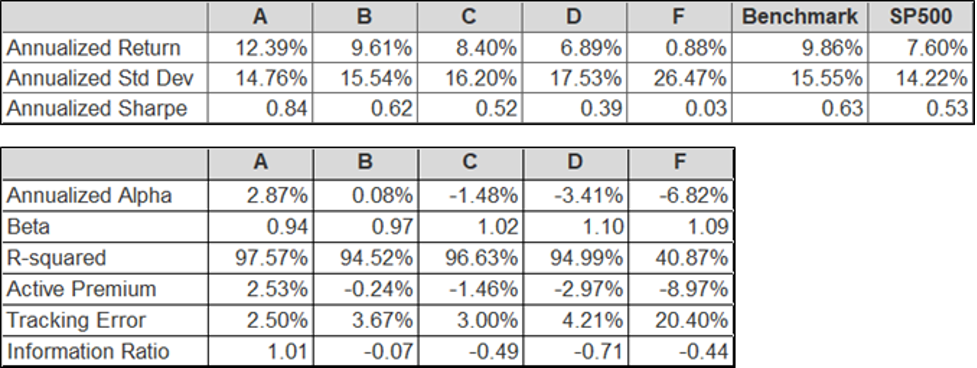
Components of the S&P 500 were analyzed from January 2010 to September 2020. On every trading day, each component of the S&P 500 was assigned a Risk-Managed Fundamental Grade per the methodology described above. An equal-weighted portfolio was created for each Fundamental Grade and then back tested. During backtesting, trading and rebalancing were performed daily. The portfolio containing stocks with Risk-Managed Fundamental Grade of ”A” outperformed all other RFG classifications as well as the equal-weighted benchmark of all S&P 500 components. Results are shown below. For context, the S&P 500 (cap weighted) price index is also included.
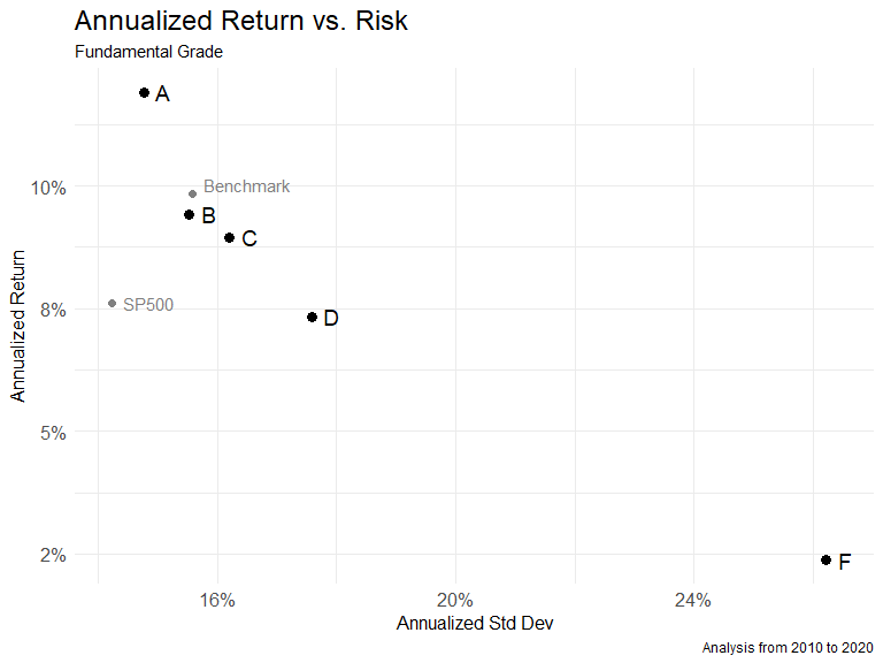
It should be noted that the return vs risk relationship between fundamental grades is opposite to what one would normally expect. Normally, one would expect risk to increase as return increases. However, here risk is reduced as return increases. This is a powerful feature of our unique method for performing fundamental analysis and building risk-managed, alpha-generating portfolios.
The Risk-Managed Fundamental Grade ”A” portfolio outperformed the benchmark 60% of the time on a monthly basis, 75% on a rolling 12 month basis, and 99% of the time on a rolling 36 month basis. This would imply that it is ideal for longer term strategies.
Conclusion
Analysis of financial statement data is the sole input to the algorithmic model that yielded the performance described in this paper. The model had no knowledge of stock price, analysts’ opinion, or other external data. Consistent with the Financial Accounting Standard Board (FASB)’s position on the objectives of financial reporting, we believe, and have demonstrated empirically, that GAAP financial statements have predictive value, providing information that is critical to making investment (resource allocation) decisions, including whether to buy, sell, or hold a company’s stock.