
Trending

Our economic prospects looked bleak back in March and April. Much of the economy was closed down, we didn’t know how bad the virus would get, and it was hard to see a good outcome.
Now the outlook is relatively better. Unemployment, GDP, and other indicators aren’t great but they’ve improved. Yet a “better” outlook isn’t necessarily a good one. It’s just “not as bad.”
Today’s numbers would be considered terrible if we weren’t comparing them to truly disastrous numbers from last spring. We avoided the worst because fiscal income replacement and business lifelines maintained consumer spending, and in some cases increased it.
If you fly a lot as I do (or used to), you’ve heard the term “stall speed.” An airplane needs to go a certain speed in order to stay aloft.
The math behind that idea is pretty simple: Lift from the wings must be equal to or greater than the plane’s weight. Lift, in turn, comes from the engine creating forward motion relative to the air. No air flow over the wings means no lift and no flight.
In economic terms, we stayed above stall speed by forcing extra fuel into the engine. The resulting forward motion gave the economy the lift it needed. Now the fuel is running out.
If this plane stalls, as is a real possibility, we won’t like the result.
Unlike airline passengers, we don’t all share the same forward momentum. Some of us are even going backward.
Income loss comes mainly from job loss. This year’s job losses have been concentrated in lower-wage service jobs.
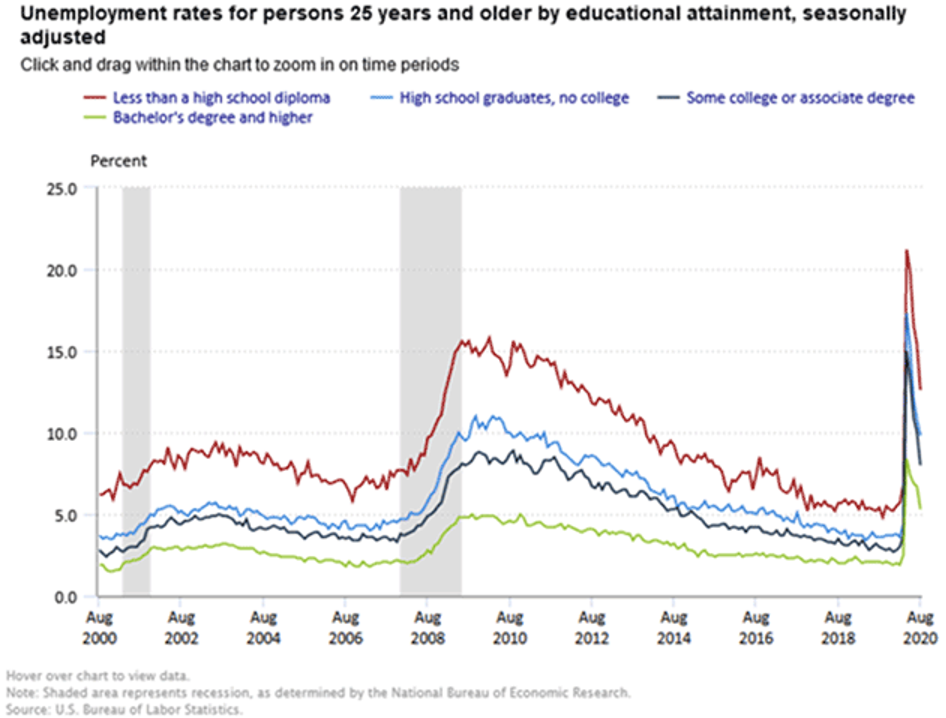
Unemployment rose across the board but was much higher for those with less education. As of August, the headline unemployment rate was 8.4%, but it was 11.8% for non-high school graduates and only 5.6% for college graduates.
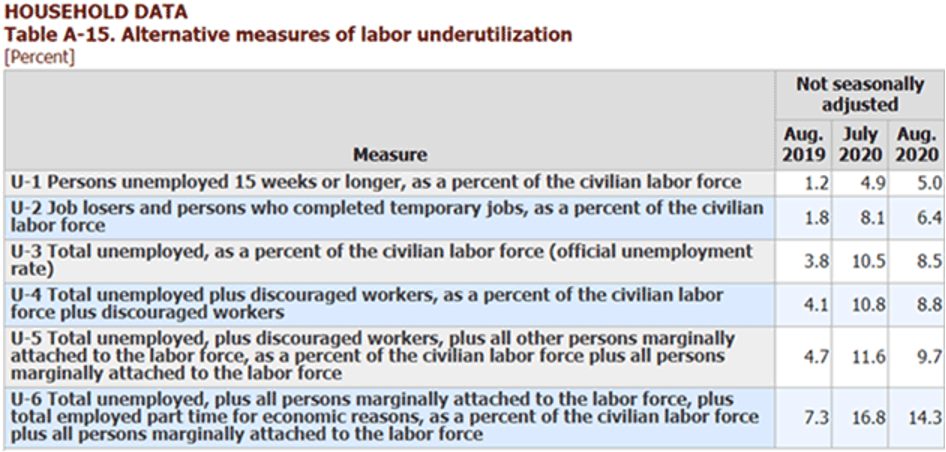
Continued unemployment claims from states suggest the monthly report undercounted the jobless workers. I assume there was some seasonal adjustment that made the difference, but seasonal adjustments are worthless during this crisis.
“U-6” unemployment is a far better indicator of where we really are.
My good friend Mike (Mish) Shedlock does an extraordinarily good job tracking the vagaries of unemployment during this crisis. Including both state and federal benefits shows a far larger number.
The chart below includes gig workers, the self-employed, people who have exhausted their state benefits, etc.
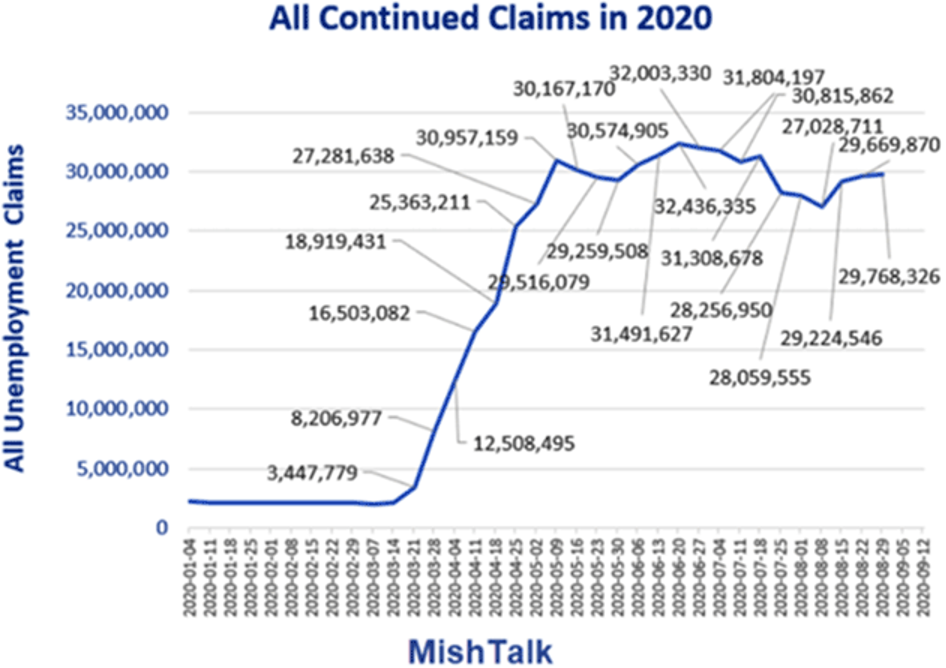
People are still falling through the cracks. We just have no way to measure it.
As I mentioned, U-6 is 14.3%. I’ll bet you a dollar to 47 doughnuts that real unemployment is closer to 16%. The rest of Mike’s post points out that while things are improving, the rate of improvement is slowing down. But back to my main point.
For a while, “unemployment” didn’t necessarily mean income loss because Congress temporarily increased jobless benefits by a flat $600 weekly, while also sending out $1,200 per person checks, actually raising some workers’ incomes. That expired at the end of July. Trump’s stopgap measures have replaced some of it, in some states, but the amounts are much smaller.
This is already showing up in consumer spending. Banks can track this because most of the benefits are delivered electronically. They can analyze spending patterns for unemployment benefit recipients vs. everyone else. Here is what happened at Bank of America in August.
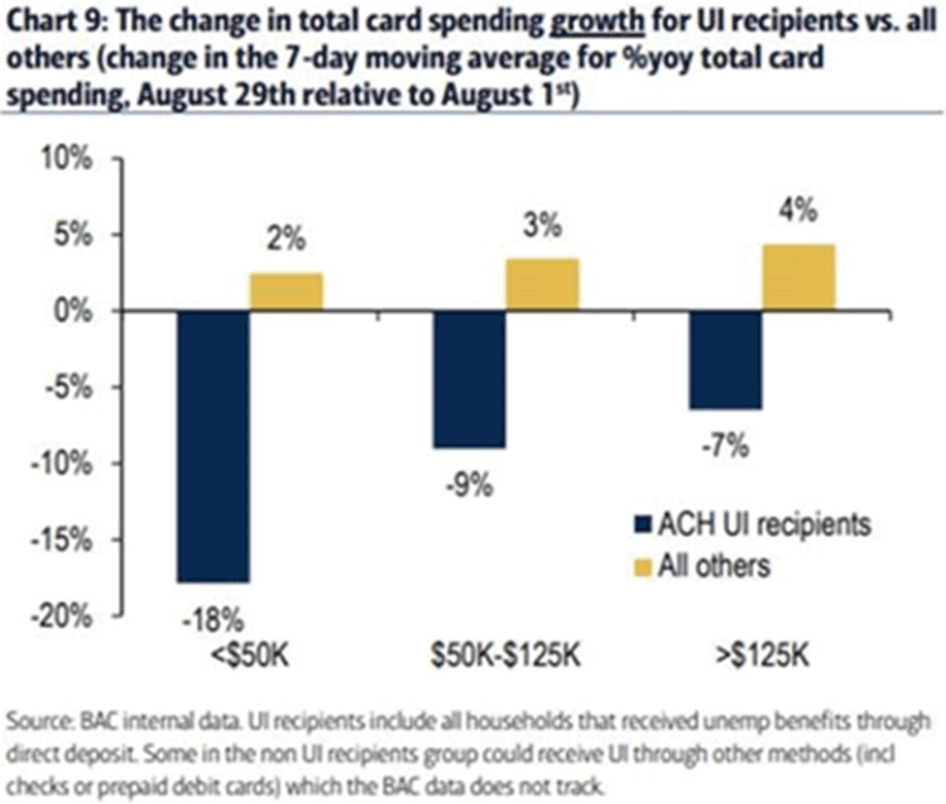
As benefits dropped, bank card spending growth fell for UI recipients while continuing to grow for everyone else. The drop was worse for lower-income consumers.
This shouldn’t surprise us. Long before COVID-19, a large part of the population spent practically all its income. Those who lost their jobs in March/April and haven’t been rehired have little choice but to cut spending. They have no reserves and little borrowing ability.
A few years ago, I wrote that 60% of America had less than $500 in savings. I haven’t seen recent data, but it is hard to imagine it’s gotten any better.
The point back then was that Americans were living paycheck to paycheck. The point now is that many Americans are living unemployment check to unemployment check.
It’s easy to forget that the enhanced unemployment benefits helped more than the unemployed people. In many cases, the “recipients” were simply conduits. They received money from the government and immediately sent it on to their lenders and landlords. The fiscal stimulus kept those people afloat, too. And its ending will hurt them, too.
In fact, the income loss hits across the board. Bank of America also knows where unemployment recipients have been spending, since it processes their card transactions.
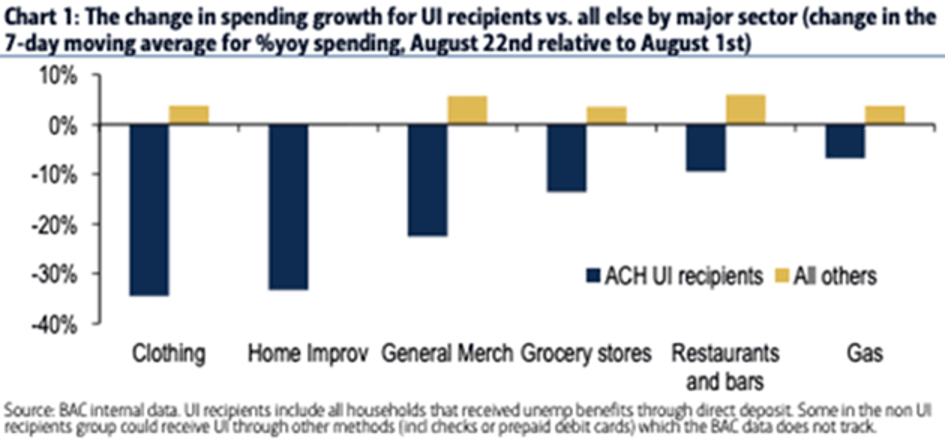
We see spending affected most in discretionary items like clothing, but also in grocery stores. And remember, this is only just beginning. Benefits payments come in arrears, so many people still got the higher amount in early August.
Quick math: If 20% of the adult population reduces spending 25%, the net effect is consumer spending falls 5%.
That, alone, leads to an even deeper stall-speed recession.
It will generate more layoffs and bankruptcies, meaning more unemployment, until something gives the economy the lift it needs.
Without that lift, even more parts of this stumble-through economy are at risk of stalling out.
The Great Reset: The Collapse of the Biggest Bubble in History
New York Times best seller and renowned financial expert John Mauldin predicts an unprecedented financial crisis that could be triggered in the next five years. Most investors seem completely unaware of the relentless pressure that’s building right now. Learn more here.