
Commodities have been a big topic over the last couple of months, Europe and parts of Asia are in an energy crisis with natural gas prices rising nearly 1,000%. Meanwhile, coffee prices have also been climbing higher with futures up over 100% during the last twelve months. However, I think both of these trends may be put under pressure. Let’s dive in…
First up lets look at coffee
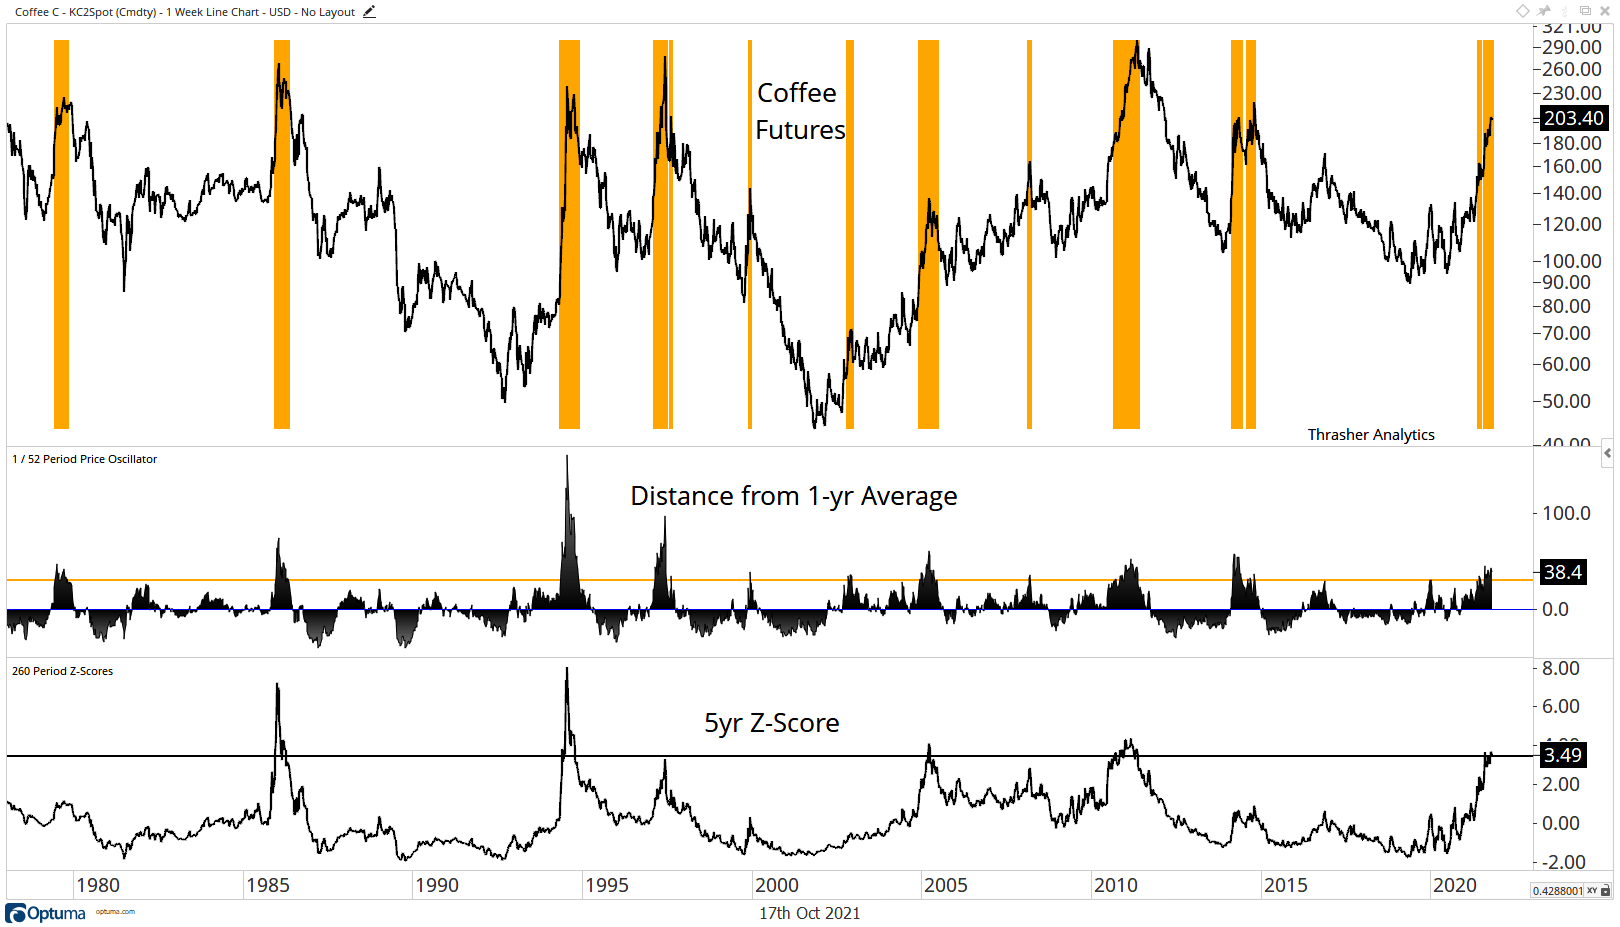
Looking at a long-term chart of coffee futures back to the 190s, we can see the crop os extremely volatile and not immune to large moves. The current 100% run has taken the commodity to nearly a 3.5 z-score (5yr), the highest since 2010 and a level coffee has only seen a handful of times. Narrowing the lookback a bit, coffee futures are over 35% above the 1-year average. The orange lines on the chart below show when price has been this far above its 1-year moving average in the past, which marks just about every major peak in coffee prices over the last 40 years.
Looking again at the mean-reversion potential of coffee, the following chart shows a custom indicator I share in my Thrasher Analytics note, running a screen across commodities, sectors, thematic ETFs, and global indices for opportunities in mean-reversion. Right now, that indicator is extremely stretched to the upside, having reached such levels just seven prior times, six of which were followed by lower price trends. Coffee futures appear ripe for mean-reversion.

How are traders currently positioned in coffee futures? Well Commercial Traders have never been this net-short in 30 years. Commercial Traders are mostly those that actually use the commodity and enter the futures market often to hedge their business’s exposure. That’s why Commercial Traders are often net-short. But when the spread between Large and Commercial Traders in coffee gets severely stretched, like it is now, it’s often followed by a reversal in price in favor of the Commercial Trader positioning. Today, that would suggest coffee prices to come down.

Next up, Natural Gas and the energy market
The energy sector has been one of the best performing sectors in 2021. XLE has risen 51% so far this year. This has sent over 80% of energy stocks to have Relative Strength Index readings above 70. Since 2014, this has happened just two prior times and both instances saw a sharp pullback in the energy sector.
Banks recently have come out with calls for $100 oil and growing expectations of poor global weather conditions that will keep a bid under natural gas and coil prices. The Economist had nat gas on its latest cover. This is all occurring while gas has actually begun to falter. Has all the bullish arguments and news been baked in already? Maybe. But what I’m more focused on is the price action and right now I see a bearish momentum divergence as natural gas starts to fall back below the September high. I’m currently watching that September swing low at $4.75.

Looking again at how traders are positioned in the commodity, Large Traders had been building up a large net-long position coming into 2020 and into 2021. However, before we saw gas get back to the 2014 highs, which has caused gas prices to throw on the breaks, they began to shed that position. Large Traders have been dumping nat gas futures for several weeks now – not something you’d expect to see if there was a strong conviction in further rising prices.
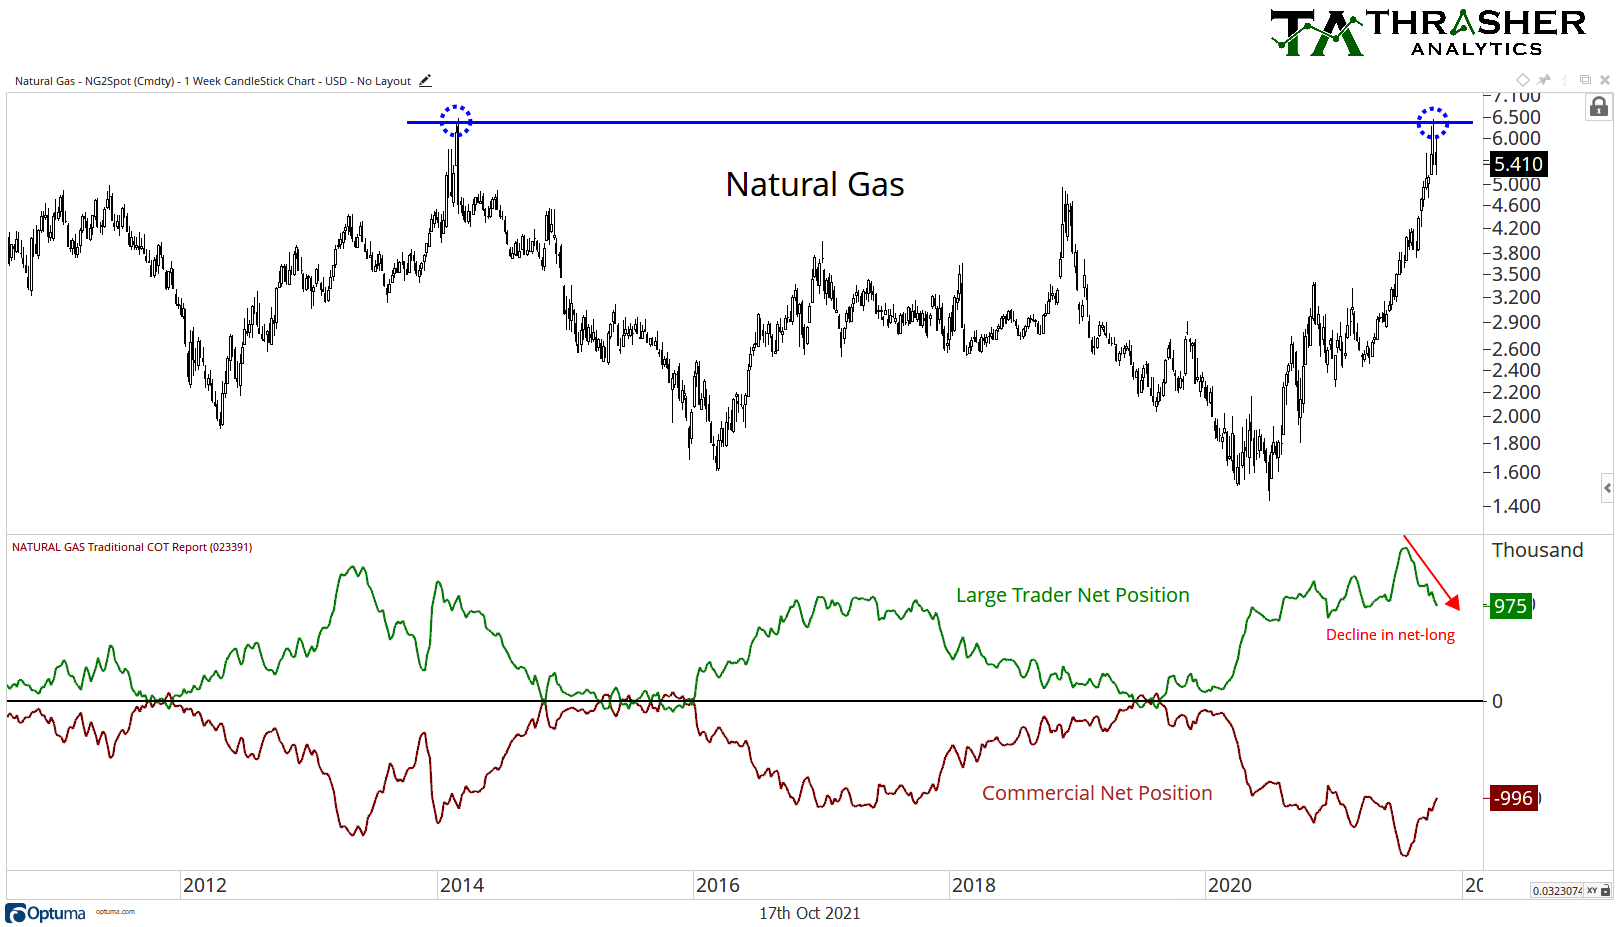
As a technician it’s hard to ignore that potential double top in natural gas futures just above $6. This bearish setup, paired with Large Traders, which rode the trend higher appear now to be taking profit and momentum starting to struggle, we may have seen a peak in natural gas.