

Trending

Written by: Samantha Azzarello and Katherine Roy
This edition of On the Minds of Investors comes from, Katherine Roy, our Chief Retirement Strategist here at J.P. Morgan Asset Management. Her team oversees The Guide to Retirement (GTR), which is a best-in-class resource for breaking down and simplifying complex retirement issues like Social Security and Medicare. The GTR provides the structure needed to have powerful and effective retirement planning conversations. One of the most popular pages in the GTR is page 43, “The impact of being out of the market” which shows that trying to time the market hurts returns. This page has always been deserving of further commentary and analysis which Katherine provides below.
Focusing investors on what they can control –how much and how consistently they save, and maintaining a well-diversified asset allocation– is key to a successful retirement outcome. During periods of extreme volatility, this can all go out the window when emotions run high. Despite all of the educational efforts and prudent processes provided by financial advisors, investors may be tempted to take control in a way that is likely to be detrimental to them - by retreating or selling out of the market after a significant drawdown – locking in their losses and looking to re-enter when the market feels ‘safer’.
This behavior is driven by loss aversion – in this situation, the desire to avoid additional losses because losses are so much more painful than gains are positive. What most investors aren’t aware of is how closely the best days often follow worst, and how important those good days are to the recovery of a retirement portfolio.
This chart from our 2020 Guide to Retirement can be very helpful in this conversation. It illustrates the worst-case outcome of this behavior to create clarity for the anxious investor. It compares the return experience of a $10,000 investment in the S&P 500 over the past 20 years to how that return is impacted by missing various numbers of the best days as a result of selling out and not being invested during the best days.
Impact of being out of the market
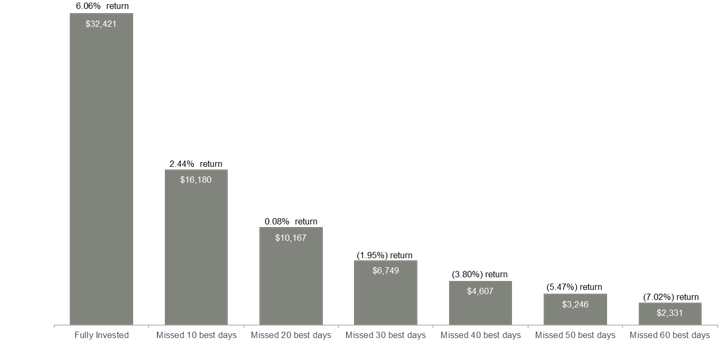
Source: J.P. Morgan Asset Management analysis using data from Bloomberg. Returns are based on the S&P 500 Total Return Index, an unmanaged, capitalization-weighted index that measures the performance of 500 large capitalization domestic stocks representing all major industries. Indices do not include fees or operating expenses and are not available for actual investment. The hypothetical performance calculations are shown for illustrative purposes only and are not meant to be representative of actual results while investing over the time periods shown. The hypothetical performance calculations for the respective strategies are shown gross of fees. If fees were included, returns would be lower. Hypothetical performance returns reflect the reinvestment of all dividends. The hypothetical performance results have certain inherent limitations. Unlike an actual performance record, they do not reflect actual trading, liquidity constraints, fees and other costs. Also, since the trades have not actually been executed, the results may have under- or overcompensated for the impact of certain market factors such as lack of liquidity. Simulated trading programs in general are also subject to the fact that they are designed with the benefit of hindsight. Returns will fluctuate and an investment upon redemption may be worth more or less than its original value. Past performance is not indicative of future returns. An individual cannot invest directly in an index. Data as of December 31, 2019.
How close are the best and worst days?
Very. As of year-end 2019, six of the best days occurred within two weeks of the worst days – but often the spread is much closer than that. Through April month end 2020, we’ve increased the streak to seven with five of those best days occurring within just one week of a worst day.
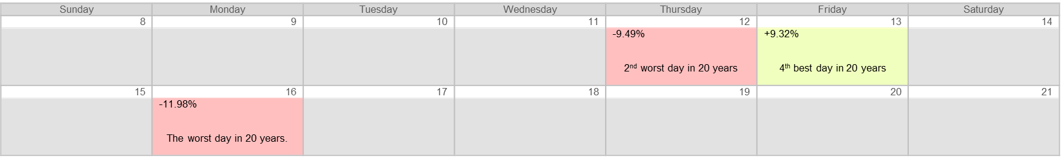
A recent extreme example:
March 2020:
Highs and lows don’t just apply to 20-year highs and lows – intra-year best and worst returns also highlight relatively tight timeframes:
August 2015:

December 2018:

Overwhelmingly the worst days occur BEFORE the best days.
From January 3, 2000 – April 19, 2020:
- Six of the seven best days occurred after the worst day.
- Seven of the ten worst days were followed the NEXT DAY by either top 10 returns over the 20 years OR top 10 returns for their respective years.
Given this reality, if someone leaves the market after experiencing a poor return, it is literally impossible for them to get invested in time to benefit from the best day that may follow. Will they miss the 10 or 20 best days? Perhaps not – but it illustrates how repetitive ‘loss aversion- induced selling’ as a habit can significantly erode the return.
Just how powerful is the return a day after a negative return day? The chart below assumes that the investor sells at the end of various negative return days, and buys back in at the end of the next day. In many cases, this is the literal definition of selling low and buying high which results in significantly less than staying invested.
Impact of being out of the market the day after a negative return
Performance of $10,000 investment between January 3, 2000 and December 31, 2019

Source: J.P. Morgan Asset Management analysis using data from Bloomberg. Returns are based on the S&P 500 Total Return Index, an unmanaged, capitalization-weighted index that measures the performance of 500 large capitalization domestic stocks representing all major industries. Indices do not include fees or operating expenses and are not available for actual investment. The hypothetical performance calculations are shown for illustrative purposes only and are not meant to be representative of actual results while investing over the time periods shown. The hypothetical performance calculations for the respective strategies are shown gross of fees. If fees were included, returns would be lower. Hypothetical performance returns reflect the reinvestment of all dividends. The hypothetical performance results have certain inherent limitations. Unlike an actual performance record, they do not reflect actual trading, liquidity constraints, fees and other costs. Also, since the trades have not actually been executed, the results may have under- or overcompensated for the impact of certain market factors such as lack of liquidity. Simulated trading programs in general are also subject to the fact that they are designed with the benefit of hindsight. Returns will fluctuate and an investment upon redemption may be worth more or less than its original value. Past performance is not indicative of future returns. An individual cannot invest directly in an index. Data as of December 31, 2019. Analysis assumes investment is sold after experiencing the negative rate or lesser return, and reinvested at the end of the next trading day.
Key conclusions
- Loss aversion can lead individuals to take control and sell equities after a market drawdown to avoid additional losses.
- This behavior can result in missing some of the best days of return because those days tend to follow the worst days with very close proximity.
- Staying invested to benefit from those best days can be critical to a portfolio’s recovery.
Other perspectives
We believe that the “Impact of being out of the market” slide helps to focus end investors on the risk associated with emotionally reacting to significant drawdowns and selling out of the market. It is not intended to illustrate a market-timing oriented investment strategy. It is often criticized as such with requests to provide the opposite view – what if an investor misses the worst days and benefits from the best?
The answer is the same – given the proximity of best days and worst days, and the fact that the worst days in most cases precede the best - market timing is impossible, stay invested.
However, there two key differences with this scenario:
- To miss the worst days there is no ‘signal’ to get out of the market – no emotional trigger moving investors to sell.
- The investor would need to buy in on the worst days during some of the most significant market drawdowns when loss aversion is at its greatest.
As a result, it is impossible to believe that someone could be smart enough to consistently miss the worst days and have the courage to invest in time to benefit from the best days.
Impact of missing the worst days – unrealistic market timing
Returns of S&P 500
Performance of $10,000 investment between January 3, 2000 and December 31, 2019
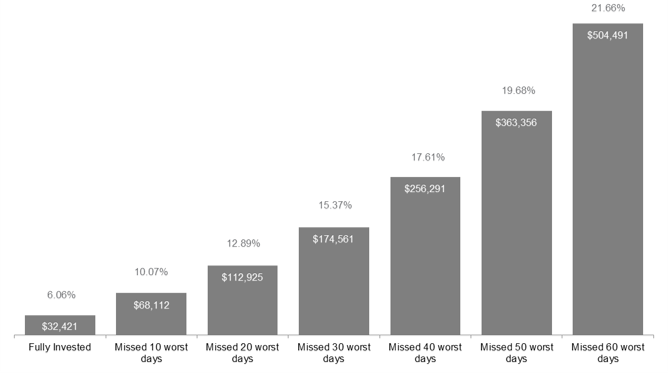
Source: J.P. Morgan Asset Management analysis using data from Bloomberg. Returns are based on the S&P 500 Total Return Index, an unmanaged, capitalization-weighted index that measures the performance of 500 large capitalization domestic stocks representing all major industries. Indices do not include fees or operating expenses and are not available for actual investment. The hypothetical performance calculations are shown for illustrative purposes only and are not meant to be representative of actual results while investing over the time periods shown. The hypothetical performance calculations for the respective strategies are shown gross of fees. If fees were included, returns would be lower. Hypothetical performance returns reflect the reinvestment of all dividends. The hypothetical performance results have certain inherent limitations. Unlike an actual performance record, they do not reflect actual trading, liquidity constraints, fees and other costs. Also, since the trades have not actually been executed, the results may have under- or overcompensated for the impact of certain market factors such as lack of liquidity. Simulated trading programs in general are also subject to the fact that they are designed with the benefit of hindsight. Returns will fluctuate and an investment upon redemption may be worth more or less than its original value. Past performance is not indicative of future returns. An individual cannot invest directly in an index. Data as of December 31, 2019.
Overall, timing the market hurts returns through the worst and best days clustering together. This has been true historically and as Katherine showed even as recently as March, when the market was very volatile. Overall, the worst and best market days are just like rain and rainbows. Generally a rainbow appears only after a thunderstorm. While intentions to miss the rain are valid, we will likely miss the rainbow that follows.
Related: What Opportunities Were Created by the COVID-19 Earthquake?