
Written by: Monica Kingsley
Going into Friday, I was still sticking to the bullish S&P 500 outlook. As the index declined, are the prospects of higher prices gone? Not at all, and today's analysis will examine the signs that still lean bullish despite the precarious technology position.
Despite the S&P 500 closing below the line connecting the early June highs, continued unemployment claims rising on the state level (don't forget about those rising ones under the federal pandemic programs either), the fate of the $600 weekly addition to unemployment benefits expiring at the end of July, or the U.S. – China confrontations.
On Thursday, I've laid out the market's sensitivities this way:
(…) as strange as it might sound, the stock market isn't about the real economy struggles these weeks. All eyes are on the stimulus and vaccine hopes (whatever one imagines under the latter term), not on the corona case panic and hyped death charts.
Stimulus is coming, and regardless of its final shape and size, markets are going to cheer it. The Fed is no longer in a wait-and-see weekly mode. Stocks expect a policy move, and are still positioned to benefit before inflation or economic realities (thornier road ahead than many an alphabet soup recovery projection implies) strike.
Talking economic realities, what about the societal and interpersonal ones? Sobering snippets of overnight U.S. corona fear transformations courtesy of Big League Politics:
- 75 percent believe that things will never return to normal
- 59 percent are too afraid to go back to their workplace with others
- 75 percent feel that handshakes will no longer be customary
- 38 percent want physical offices permanently removed and replaced with remote work
- 53 percent are nostalgic for the good old days when people weren’t forcibly masked while the rest have seemingly become accustomed to the "new normal".
Such shifts underscore why some sectors have it way tougher than others.
S&P 500 in the Medium- and Short-Run
I’ll start today's flagship Stock Trading Alert with the higher timeframe perspective (charts courtesy of http://stockcharts.com ).
The weekly candlestick (please see this and many more charts at my home site) bears shape of a reversal, but is it a credible one? Weekly volume didn't pick up, weakening the case for a trend change. The preceding week brought us a hanging man, and that didn't bring the bears out of their caves either.
The weekly chart is thus rather neutral in its implications, but given the non-refusal (by and large) of the move above the early June highs, I still interpret the chart as bullish rather than bearish.
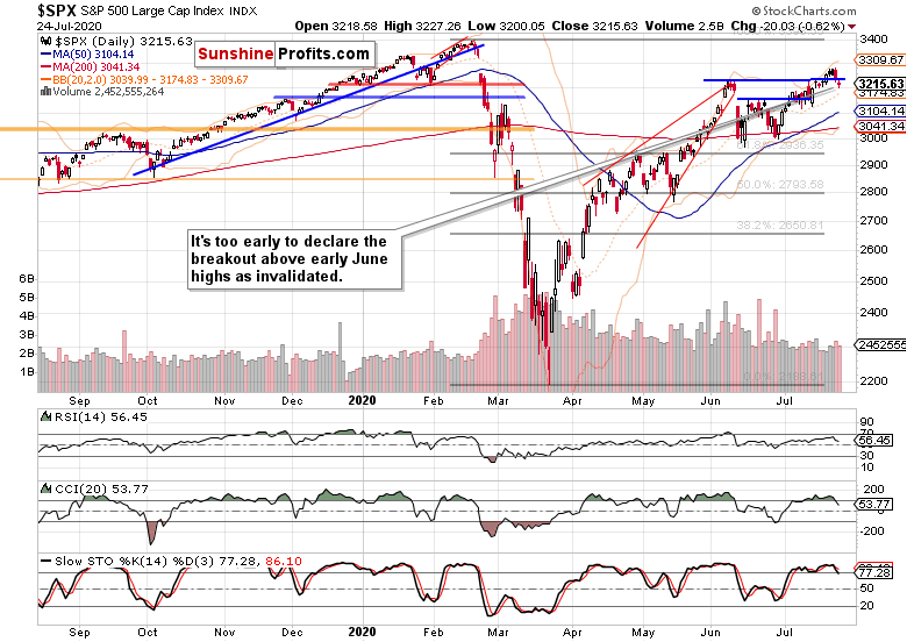
One close below the line connecting the early June highs, doesn't make a breakout invalidation yet. It lack rising volume, and the noticeable lower knot also makes it suspicious.
As the bulls nibble at the late-Feb bearish gap, I expect them to overcome it eventually. Especially since all eyes are on the stimulus to counter the harsh economic realities of many real economy sectors.
Such were my Friday's words regarding the days finishing in the red:
(…) Earlier in July, we have also experienced an odd bearish day that brought out the bears from their caves, without really changing the situation on the ground materially.
I expect the same dynamics to play out this time as well, regardless of the headlines touting more stimulus details only next week, or Trump discussing the China phase one trade deal value.
Meanwhile, the credit market signals are still pointing largely one way.
The Credit Markets’ Point of View
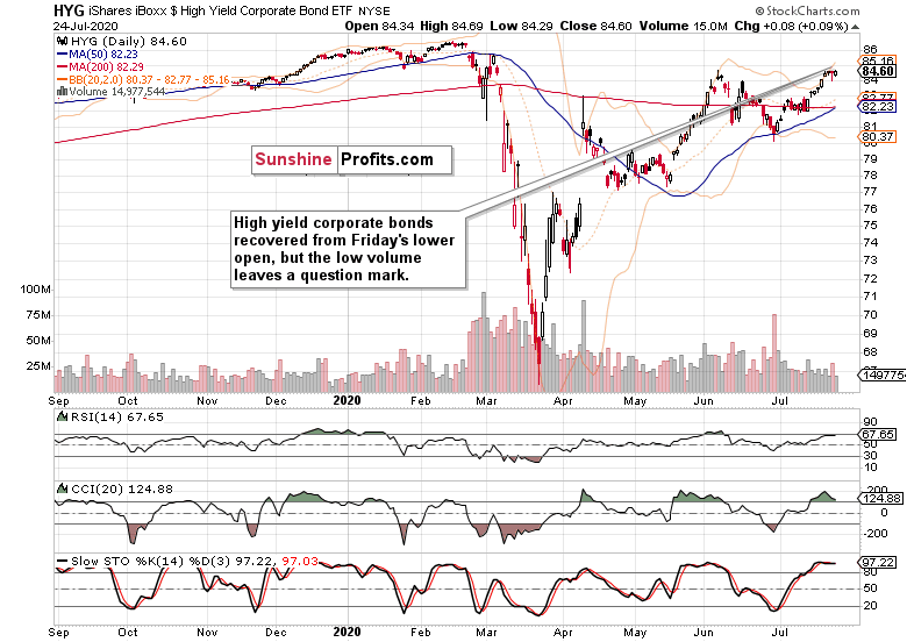
High yield corporate bonds (HYG ETF) reversed their opening weakness, and closed near the upper border of its recent range. Encouraging in itself, the move though lacked convincing volume, which makes the implications less bullish than when viewed with only price action in mind.
The ratios finetune the picture. Both the leading credit market ratios – high yield corporate bonds to short-term Treasuries (HYG:SHY) and investment grade corporate bonds to longer-dated Treasuries (LQD:IEI) paused – with the latter declining. This one-day hesitation has the potential to spill over into upcoming sessions' trading.
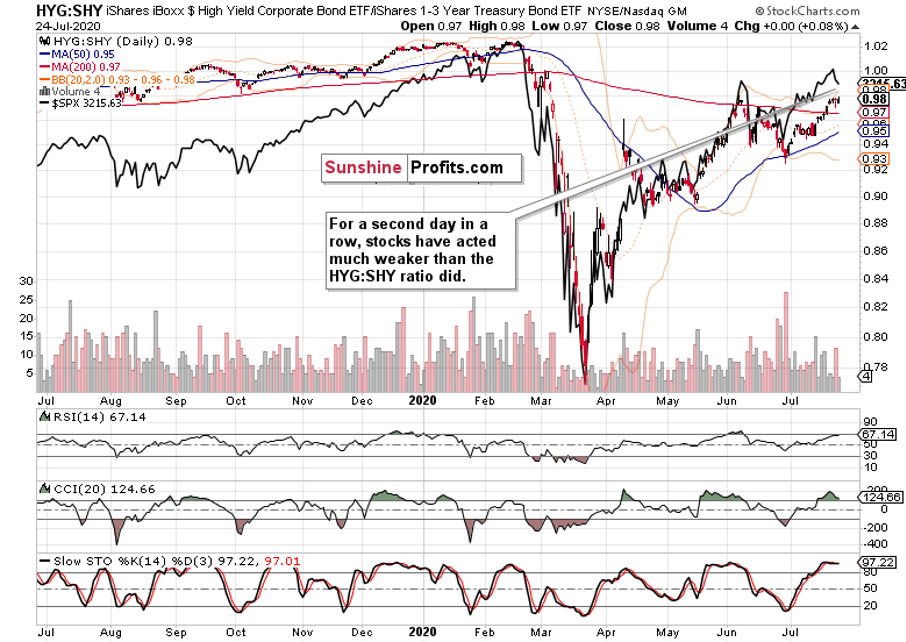
The overlaid S&P 500 closing prices (black line) against the HYG:SHY chart shows just that the pace of stocks' fall, has moderated. With more air out of their relative outperformance seen since late June, the judgmental scope for further declines becomes more limited. Unless the ratio plunges, that is – which is what I don't expect it to do right now.
The recovering ratio of high yield corporate bonds to all corporate bonds (PHB:$DJCB) supports the notion of the stock bull having further to run. The sectoral rotation theme stands to benefit from such a dynamic.
Smallcaps, Emerging Markets and the S&P 500 Internals
The Russell 2000 (IWM ETF) also fell on Friday, but the daily volume left quite something to be desired. For the bears, that is. As a result, Friday's candle appears to be merely a daily setback.
Emerging markets (EEM ETF) proved stronger on Friday, and erased their opening losses almost in full. That's positive for stocks back in the States too – it's a starting point, and obviously more has to follow.
Volatility ($VIX) made an intraday reversal on Friday, though a retest of its opening highs wouldn't be out of the unexpected. This upside bump appears to have a little more to run on the upside, but judging by this chart alone, the stock bull run isn't in danger yet.
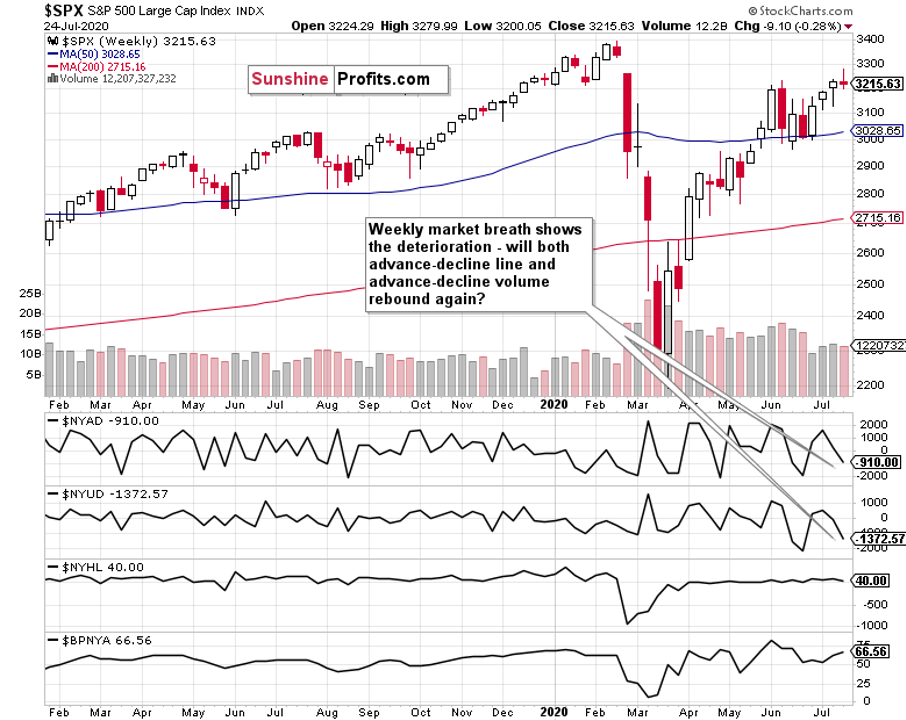
Zooming out, the weekly market breadth provides us with a broader perspective. Please note both the advance-decline line and advance-decline volume having descended into solidly negative values – but the bullish percent index solidly in bull market territory makes a case for an upcoming stock price rebound (perhaps preceded by a bit more base-building).
S&P 500 Sectors in Focus
Technology (XLK ETF) holds the key, and not merely in the short-term. On a positive note, it has reversed intraday, closing slightly above its opening values. The rising volume indicates accumulation to me, lending more credibility to the bullish interpretation.
The defining moment though can't be understated. This sector's consolidation with an upside flavor would be very constructive for the S&P 500, as the ongoing rotation into former laggards can't win the day due to weighting.
But the rotational stock bull signs of health are undoubtedly in. I would highlight materials (XLB ETF), healthcare (XLV ETF) and industrials (XLI ETF) as the best of the crowd, followed by the defensive utilities and consumer staples (XLU ETF, XLP ETF respectively). Consumer discretionaries (XLY ETF) are also fighting tooth and nail to keep among the leadership sectors, which is where the heavyweight financials (XLF) are slowly but surely moving too.
Once technology joins in again (or stops standing in the way as a minimum), the stock bull run can go on and leave this soft patch with bullish undertones behind.
Summary
Summing up, Friday's S&P 500 setback hasn't materially changed the optimistic stock outlook, and the balance of signals from related markets still keeps more than slightly favoring the bulls. Technology is the joker, the wild card that would decide the S&P 500 direction in the short run, and either prolong this two-day decline, or let stocks slowly but surely regain their footing, which they seem bound to do still.
Related: The S&P 500 Is Hungry for Stimulus – And Will Get It