
Trending

Our Daily Market Commentary* provides market insight, analyzes economic and financial news, and highlights a few graphs worthy of discussion. Occasionally, we stumble upon a graph that deserves more than the paragraph or two we typically allot in the Commentary. The chart below, courtesy of SoFi and Bloomberg, is one example. It compares real rates and stock valuations.
The graph presents the inverse relationship between real interest rates and stock valuations. It shows the traditional relationship has broken down since October 2022. The recent divergence and the likelihood it reverts to normal have implications for stock prices and bond yields.
*Our Daily Commentary is a great way to start the day. In just a few minutes, you can read our latest market thoughts and brief discussions of a few timely topics of interest. Click HERE to sign up and receive it free in your inbox every morning.
Stock Valuations and Real Rates
Despite widespread misunderstanding, the dollar price of a stock doesn’t tell us how rich or cheap it is. Apple currently trades at around $175 a share. It would trade at about $2.75 trillion if only one share existed. Despite how far apart the two prices are, both prices signify the identical value proposition.
Therefore, stock valuations provide a much more genuine gauge of the actual price of a stock.
Coca-Cola (KO), for instance, is worth $260 billion. Is it rich, cheap, or fairly valued? KO’s valuation ratios compare critical fundamental data to its stock price or market cap, allowing investors to assess whether $260 billion is the right price to pay for KO’s future cash flows.
Real interest rates, the current interest rate less inflation or the expected inflation rate, perform a similar task for bonds. Is an 8% bond yield rich or cheap? The yield level is meaningless without an appreciation for inflation, economic growth trends, and Fed policies. 8% may sound fantastic, but would you think so if inflation ran at 12% and was expected to remain in double digits for a decade?
The Stock Bond Relationship
Low or negative real rates are economically stimulative as the incentive for people and companies to borrow and spend or invest is much higher than when real rates are high.
Consequently, periods of low real rates frequently accompany higher stock valuations. Conversely, high real rates restrict economic activity. They tend to weigh on corporate profits, stock prices, and valuations.
The graph we led this article with affirms the logical inverse relationship between stock valuations and real rates. However, since October 2022, the correlation has broken down. Real rates have risen sharply to fifteen-year highs over the last ten months. Despite the coming economic and financial burden of higher real rates, stock valuations have risen alongside real rates. That shouldn’t happen in theory, but theory and short-term speculative periods often disagree.
The recent period of increasing real rates and valuations is not sustainable. Therefore, we must ask, how will the relationship normalize?
- Lower yields?
- More inflation?
- Declining stock prices?
- Higher earnings?
Or will some combination close the irregular gap? To help answer, let’s look at the relationship between valuations and real rates over more extended periods.
Historical Relationship of Rates and Valuations
To better appreciate the correlation over more extended periods than the initial graph, we present monthly data for real rates and stock valuations in scatter plot format. Our real rate calculation uses the Cleveland Fed’s 10-year inflation expectations estimate and the 10-year U.S. Treasury yield. We use forward price to earnings as our stock metric to remain forward-looking with stock valuations.
Interestingly, the relationship between real rates and stock valuations breaks when the real rate is below 1%. As such, the first graph shows a strong correlation when the real rate was 1.0% or greater.
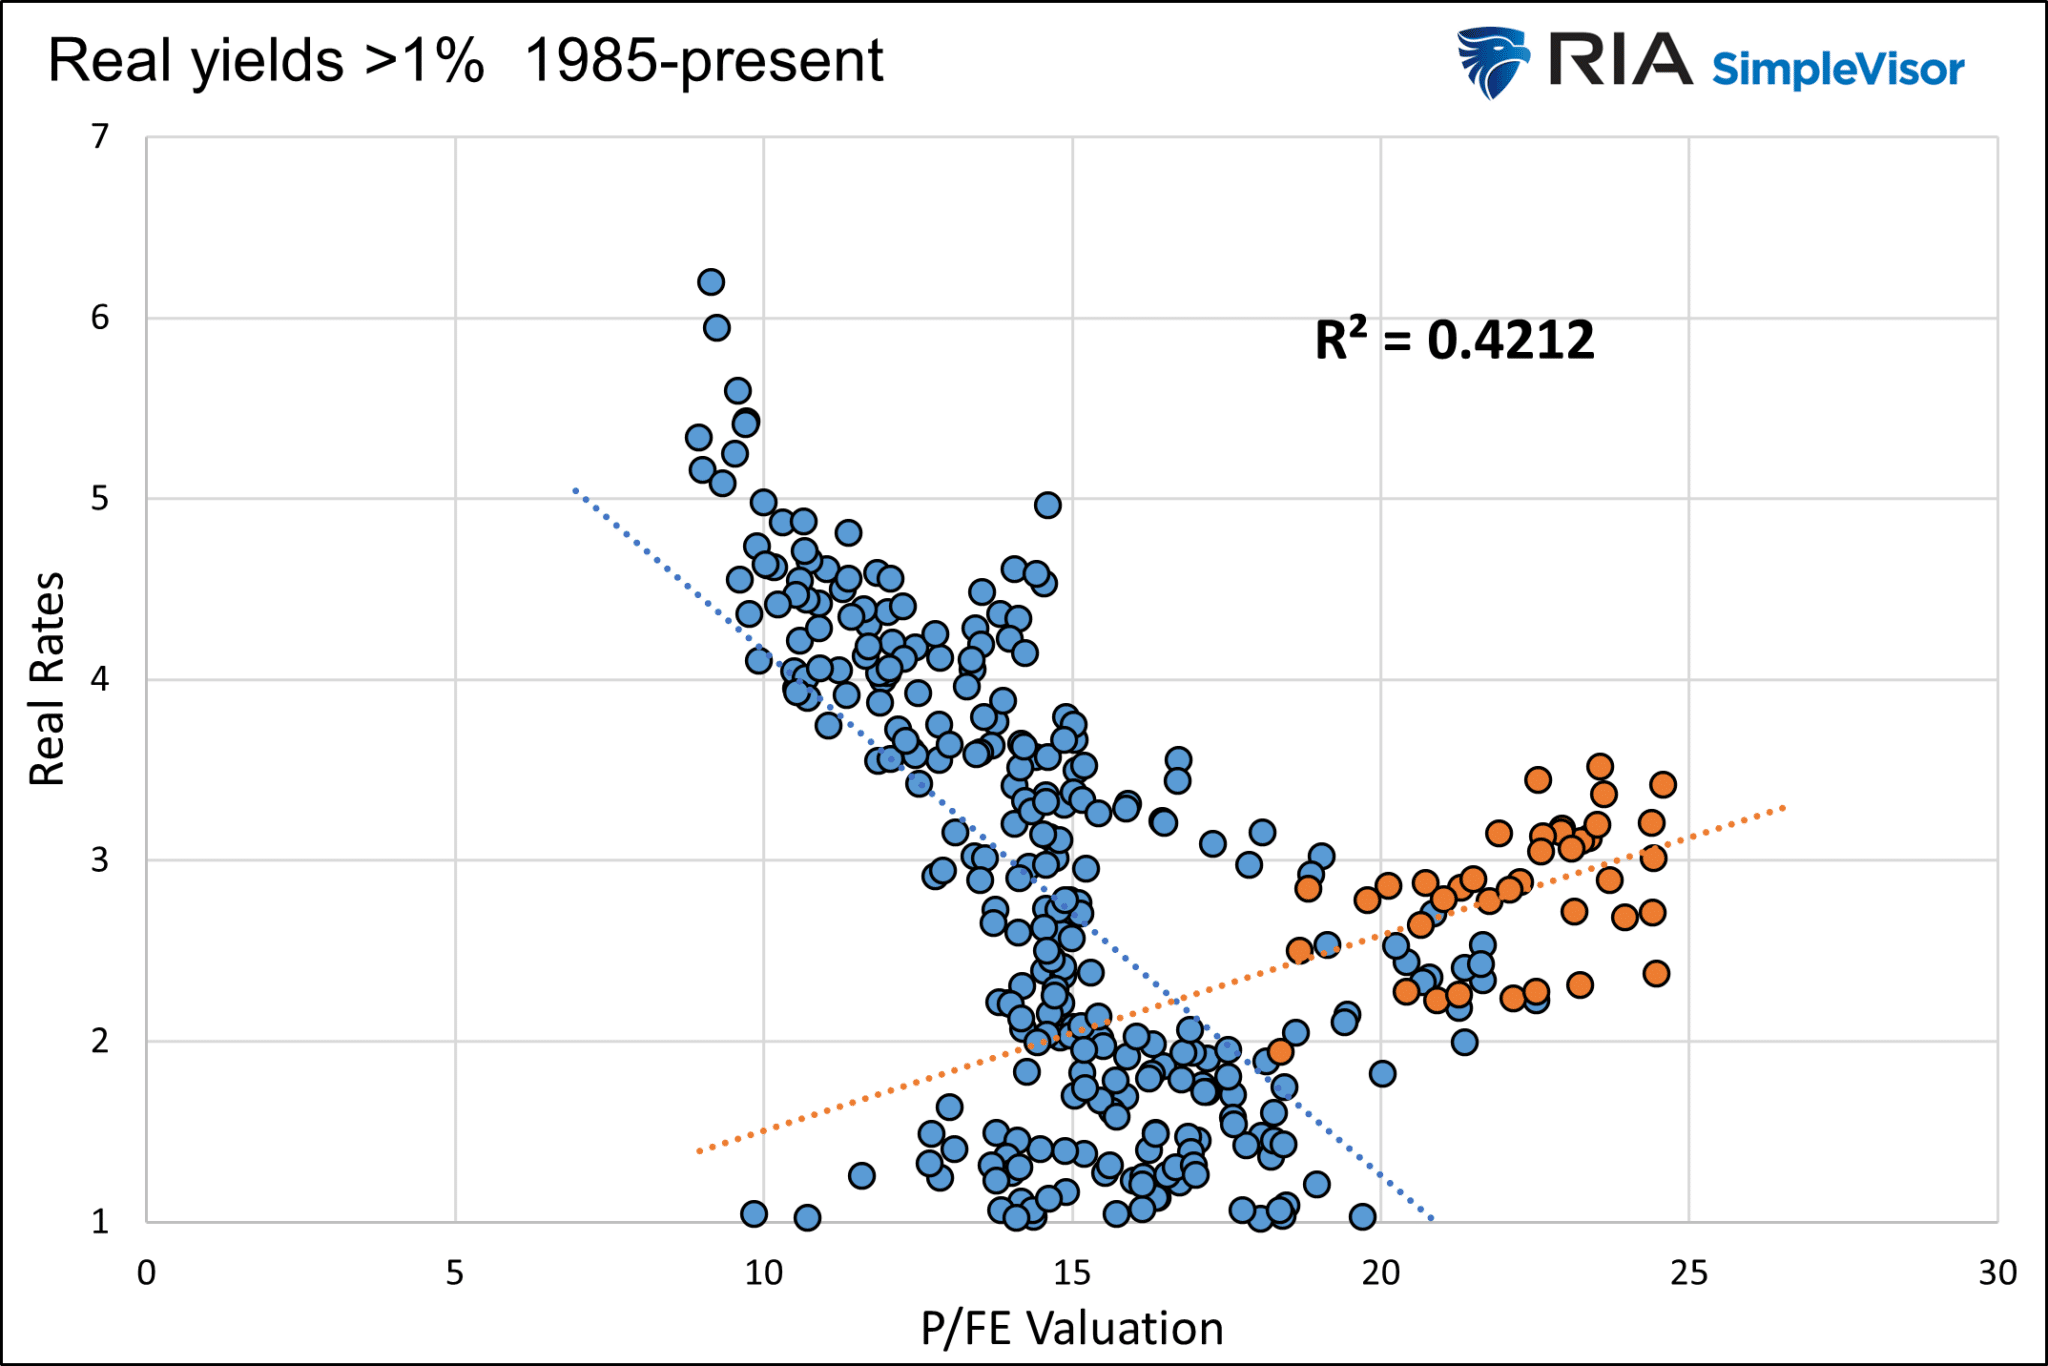
Note that the correlation is good (r-squared of .4215); however, from 1998 to 2001 (orange), the relationship was inverse that which is typical. Higher rates led valuations upward in the speculative lead-up to the dot com crash. A similar environment seems to be occurring today.
Since 1985, the relationship has been statistically meaningless when real rates are below 1.0%. Yet, despite a low r-squared (.0781) for that data set, the data still trend from the top left to the bottom right, signifying that even with low or negative real yields, there is an inverse relationship.
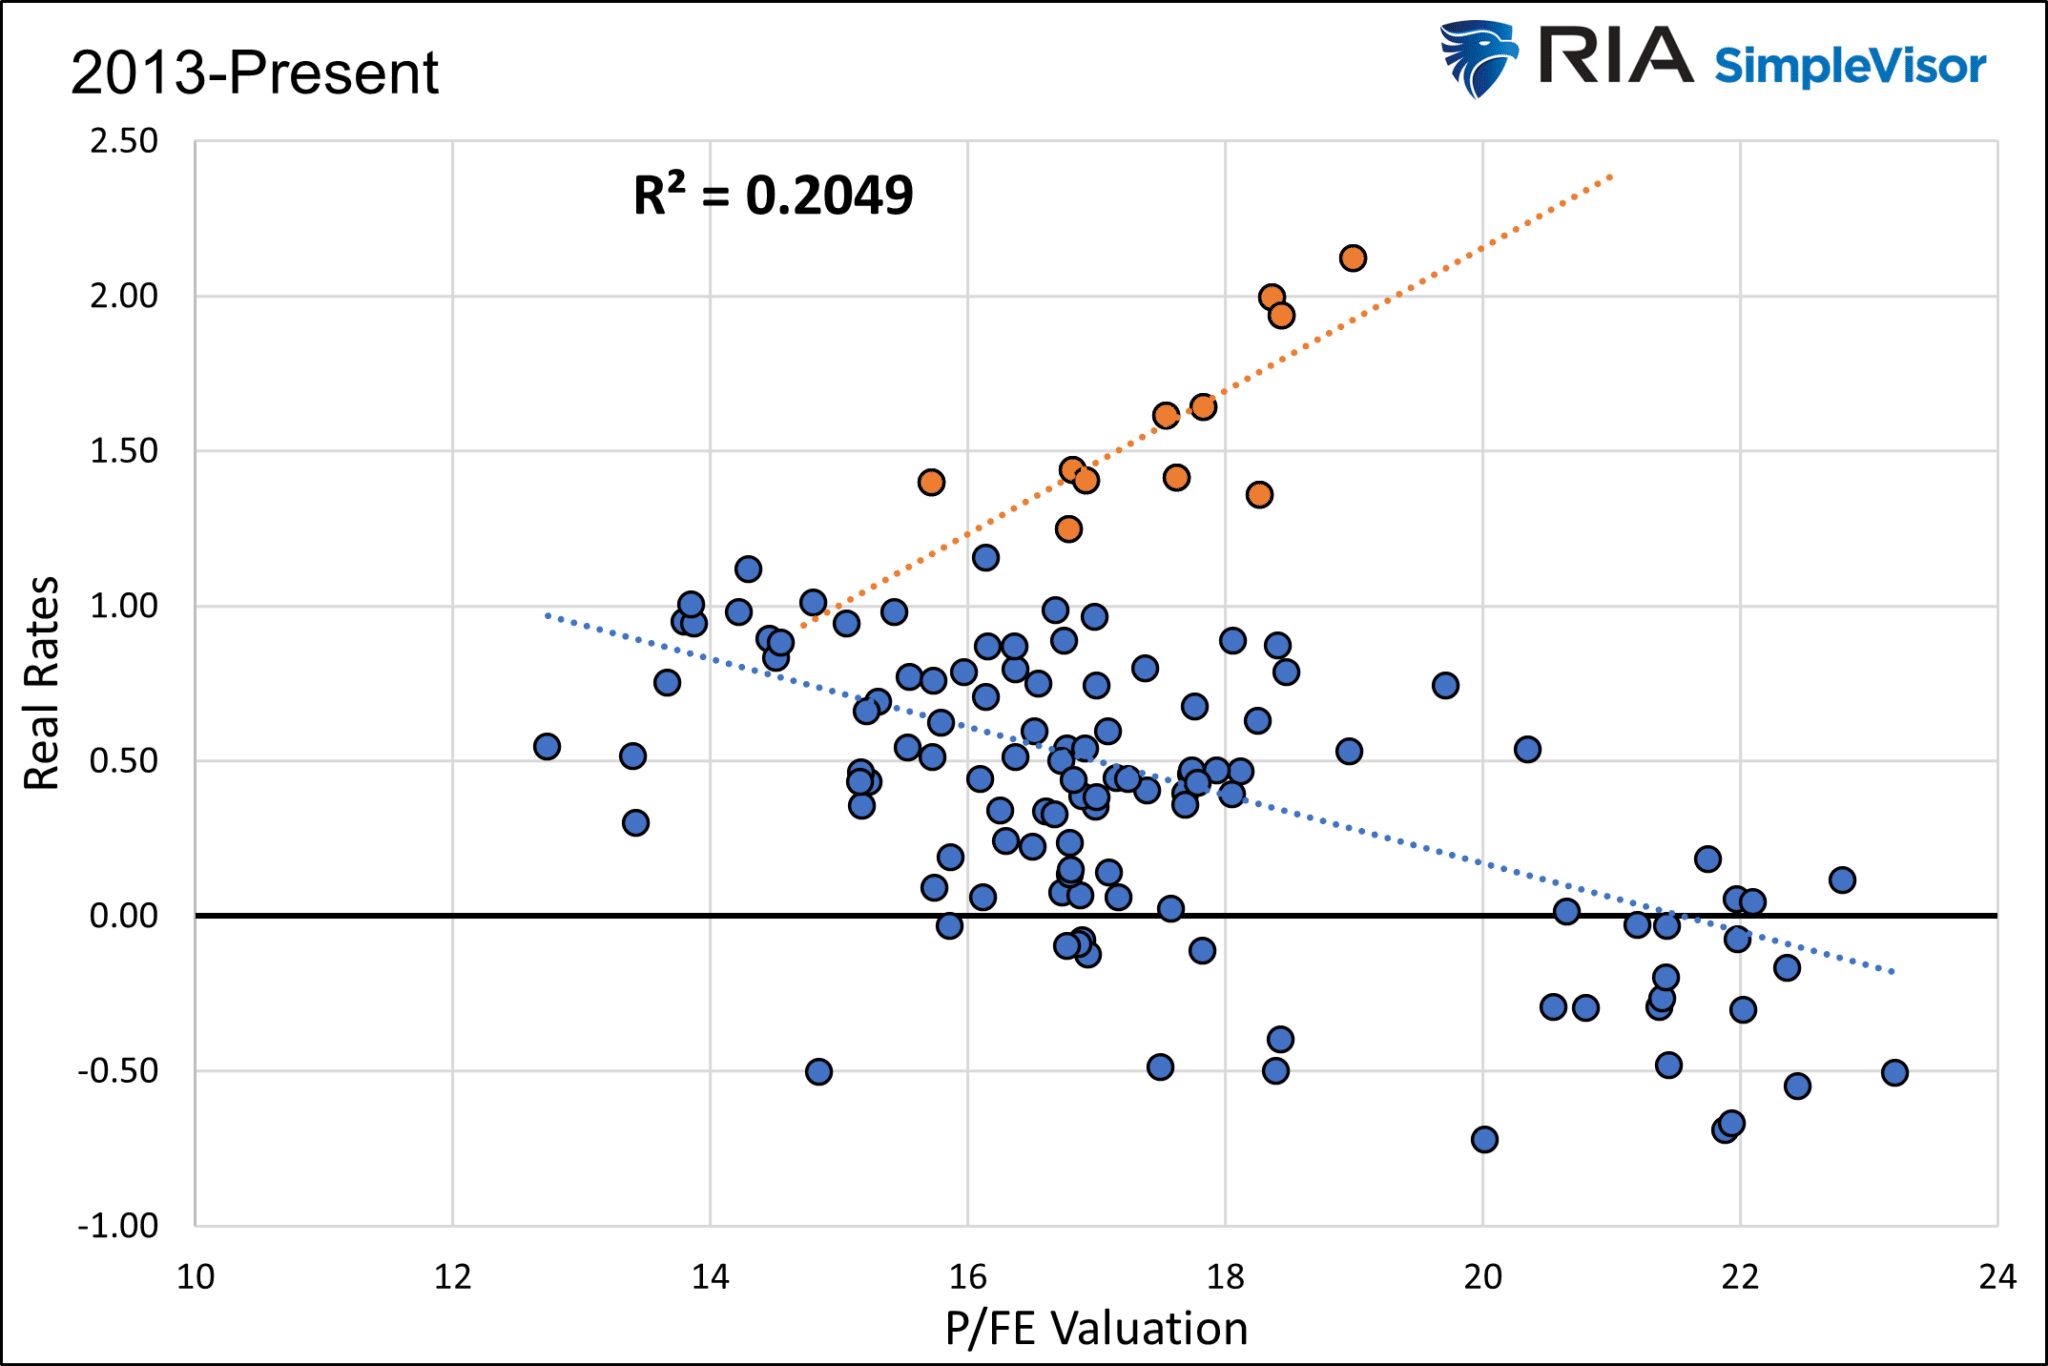
Since the 2008 financial crisis and the ensuing easy money Fed policies, real rates below 1% have been the norm. The following scatter plot shows that, unlike 1985 to 2007, the recent relationship has a decent correlation despite real rates predominately below 1%. The orange dots represent the current deviation from the typical relationship, which started in October 2022.
How Might The Relationship Between Real Rates and Stock Valuations Normalize?
How will the divergence end: Lower yields? More inflation? Falling stock prices? Higher earnings? Or will a combination close the irregular gap?
Normalization Via Real Rates
If the relationship normalizes solely due to real rates declining, then interest rates and or inflation expectations would be lower by default. Using the data from the scatter plot (1985-present), real rates in that scenario would fall from 2.10% to approximately 1.25% to return to trend. If inflation is stable, interest rates would fall by .85% to get real rates to trend. However, if inflation returns to the 2% Fed target, bond yields would fall by about 2% to get to the trend.
To reiterate, that scenario assumes valuations do not change.
Normalization Via Valuations
The opposite approach assumes real rates do not change. Instead, valuations adjust to get the relationship back to trend.
If the relationship normalizes with stock valuations falling toward the regression trend line, we must assume stock prices drop and or earnings expectations rise. Either way, the forward P/E would fall from 19.50 to 16. If that were to occur, either stock prices fall by about 18% or forward earnings increase by 22%. The risk to that math is that weaker economic growth reduces earnings forecasts, and the corresponding correction in stock prices must be larger than 18% if the relationship normalizes.
However, if real rates fall, stock valuations do not need to correct as much as we calculate.
Summary
The relationship between real rates and stock valuations makes a lot of sense. How the Fed runs monetary policy, whether too restrictive, stimulative, or just right, significantly impacts the economy, interest rates, and corporate earnings.
The temporary disconnect between real rates and equity valuations will eventually correct. The question is how. We discussed a few possibilities, but the honest answer is that history is an imperfect guide. The last significant divergence in 2008 resulted in a sharp correction in stock valuations and much lower bond yields.
Regardless of our guess or yours, it is most important to appreciate the relationship and the recent divergence and be ready for the historical trend to reassert itself.