
Written by: Przemyslaw Radomski, CFA
With inflation getting worse, has the Fed woken up? And with the USD looking bright, gold, silver, and mining stocks continue to feel the pinch.
By the way, I most recently discussed the short and medium-term outlook for silver in both charts and a video analysis. Please check them out.
With U.S. nonfarm payrolls coming in weaker than expected on Oct. 8, the Fed’s taper timeline was once again in the spotlight. However, with the U.S. unemployment rate falling to 4.8% (versus 5.1% expected) and the weakness mainly driven by a decline in government payrolls (private payrolls increased by 317,000), the lukewarm print should still meet Chairman Jerome Powell’s taper threshold.
To explain, July’s data was revised upward by 38,000 (increased for the second time), while August’s data was revised upward by 131,000. As a result, 169,000 more jobs were added than previously reported.
Please see below:
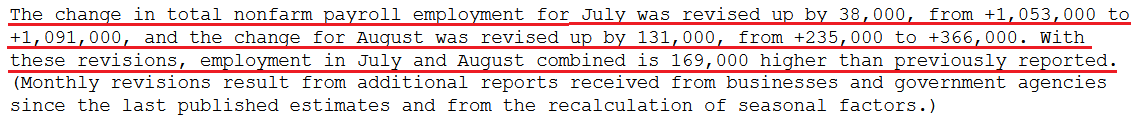
Source: U.S. Bureau of Labor Statistics (BLS)
What’s more, with inflation surging and the “transitory” narrative suffering a slow and painful death, the Fed is having its ‘come-to-Jesus’ moment. For context, I’ve been warning for months that the central bank remains materially behind the inflation curve.
I wrote on Apr. 30:
With Powell changing his tune from not seeing any “unwelcome” inflation on Jan. 14 to “we are likely to see upward pressure on prices, but [it] will be temporary” on Apr. 28, can you guess where this story is headed next?
To that point, Atlanta Fed President Raphael Bostic said on Oct. 12:
“I believe evidence is mounting that price pressures have broadened beyond the handful of items most directly connected to supply chain issues or the reopening of the services sector.... Up to now, indicators do not suggest that long-run inflation expectations are dangerously untethered. But the episodic pressures could grind on long enough to unanchor expectations.”
More importantly, though, he admitted:
“Transitory is a dirty word…. It is becoming increasingly clear that the feature of this episode that has animated price pressures – mainly the intense and widespread supply chain disruptions – will not be brief. By this definition, then, the forces are not transitory.”
And how does this impact his taper timeline?
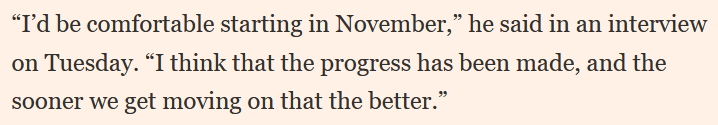
Source: the Financial Times
Also making the rounds, Fed Vice Chairman Richard Clarida supported the hawkish rhetoric on Oct. 12. Speaking at the Institute of International Finance’s virtual annual meeting, he said that “the risks to inflation are to the upside.” And after conceding that “the big unknown right now is how long it will take for these bottleneck effects to work their way through,” he admitted:
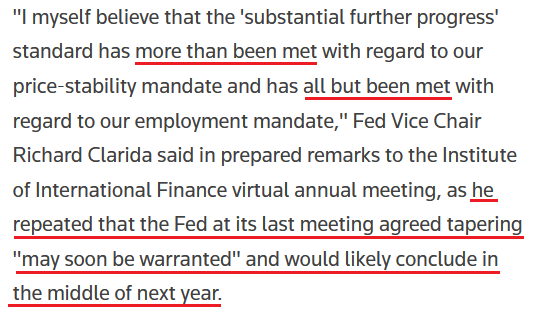
Source: Reuters
For context, if the Fed concludes the taper by the “middle of next year,” the timeline is extremely hawkish. To explain why, I wrote on Sep. 23:
With ~$120 billion worth of bond purchases poised to hit zero in roughly nine months, the accelerated liquidity drain is extremely bullish for the USD Index.
Please see below:
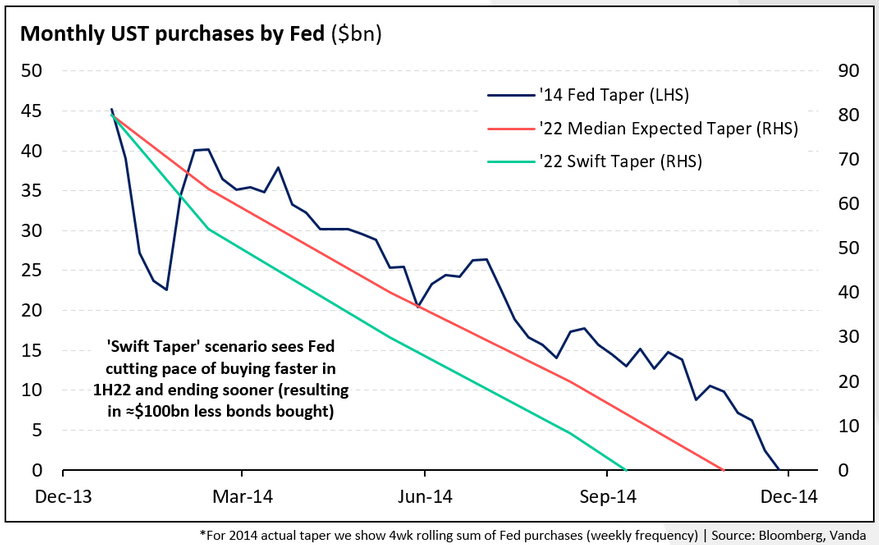
To explain, the dark blue line above tracks the pace of the Fed’s taper following its announcement in December 2013, while the orange line above tracks the consensus estimate this time around. However, if you focus your attention on the light blue line, you can see that Powell’s taper timeline pushes QE to zero in advance of both the precedent set in 2014 and the current consensus estimate.
On top of that, while the Fed has finally opened its eyes to persistent inflation, the central bank is still operating in the rearview. To explain, while Fed officials seem to agree that tapering is necessary to calm inflation (which we also agree on), at the current rate, the hawkish shift isn’t nearly hawkish enough.
For example, while I’ve been sounding the alarm on the cost-push inflationary spiral for months, Brent and WTI prices are now trading north of $80 per barrel and Citigroup said that winter weather could uplift the former to $90 per barrel in the fourth quarter. For context, Citigroup, Goldman Sachs and Bank of America are all forecasting $90+ per barrel Brent this year. And while The White House called on OPEC (for the second time) to “do more” (increase supply to reduce oil prices), the cartel has ignored the pleas. As a result, if oil’s upward momentum persists, the Fed is materially underestimating the inflationary impact.
Second, while commodity prices remain the most important driver of inflation, even “transitory” factors have leaped to new highs. For context, I wrote on Apr. 16:
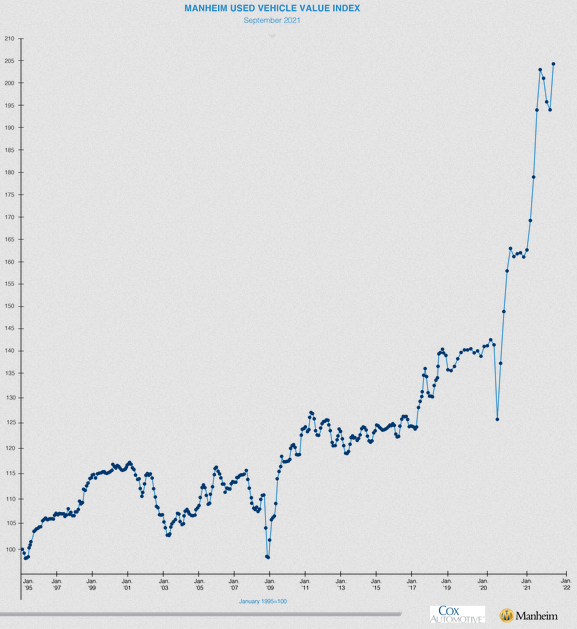
The Manheim Used Vehicle Index – compiled from a database of more than five million annual used vehicle transactions – increased by 5.87% month-over-month to a record high 179.2 in March. What’s more, the pace of the surge is unlike anything that we’ve ever witnessed before.
And after a brief pause – which even we conceded given that abnormally high used car prices should be “transitory” – Manheim revealed that wholesale used vehicle prices “increased 5.3% month-over-month in September” and “brought the Manheim Used Vehicle Index to [a record high] 204.8.”
Please see below:
In addition, Oshkosh Corporation – an American manufacturer of specialty trucks, military vehicles, truck bodies, airport fire apparatus and access equipment – reduced its full-year revenue and earnings guidance on Oct. 8. The company cited “significant supply chain and logistics disruptions as well as material and freight cost inflation similar to other companies that are beyond the company’s prior expectations.”
CEO John C. Pfeifer added:
“We implemented multiple price increases in our non-defense segments over the past six to nine months to combat unprecedented raw material inflation and freight cost escalation. Based on current conditions, we expect that our pricing actions will cover our higher input costs. However, due to our backlogs, we do not believe this price catch-up will occur until the end of the second quarter of Calendar 2022. If cost escalation persists, we will take additional pricing actions.”
On the other side of the inflationary coin, the NFIB released its Small Business Optimism Index on Oct. 12. And while the headline index declined from 100.1 in August to 99.1 in September, wage inflation rose to levels unseen since the 1970s.
Please see below:
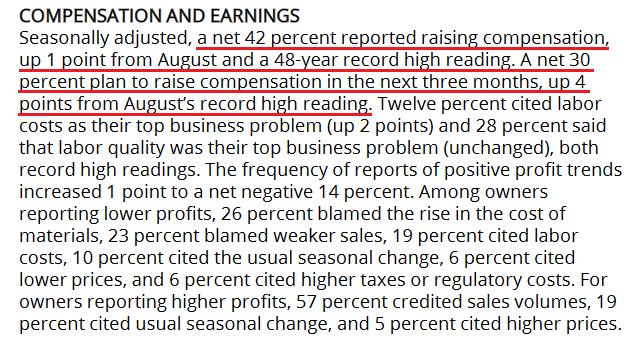
Source: NFIB
Furthermore, while “the net percent of owners raising average selling prices decreased 3 points to a net 46 percent,” output inflation still remains at a more than 30-year high.
Please see below:
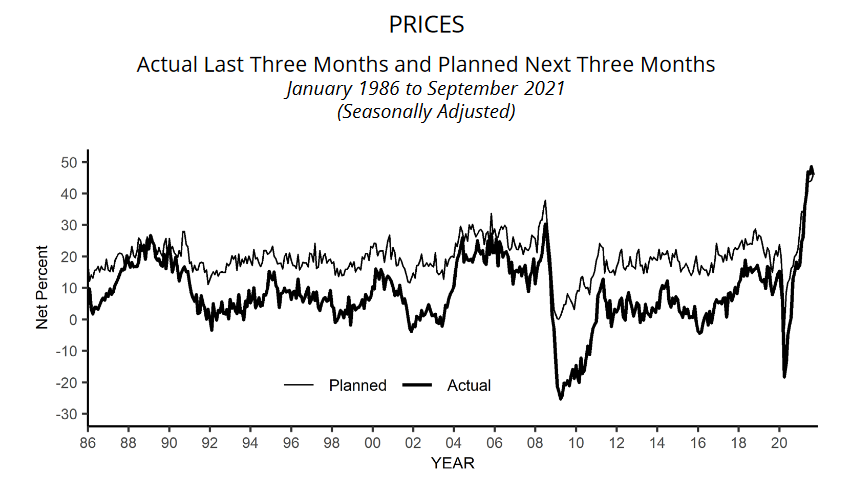
Source: NFIB
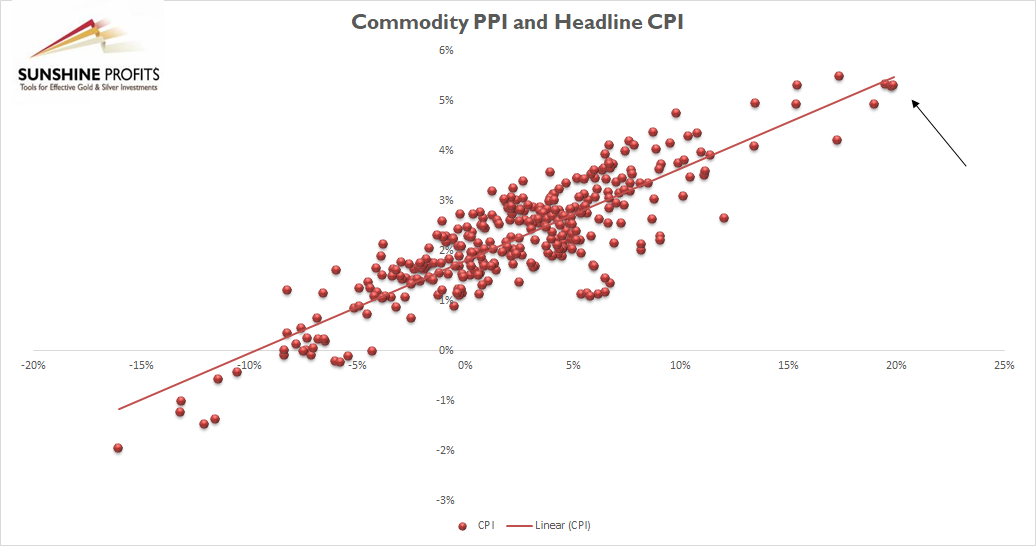
Finally, I’ve mentioned on several occasions that the commodity Producer Price Index (PPI) will likely determine when/if the inflationary momentum subsides. For context, its relationship with the headline Consumer Price Index (CPI) remains right on trend (follow the black arrow below):
And with the headline CPI the most important fundamental data point released today, I wrote on Sep. 15 that “another headline CPI print of roughly 5.25% to 5.75% should hit the wire when the data is released on Oct. 13.
Please see below:
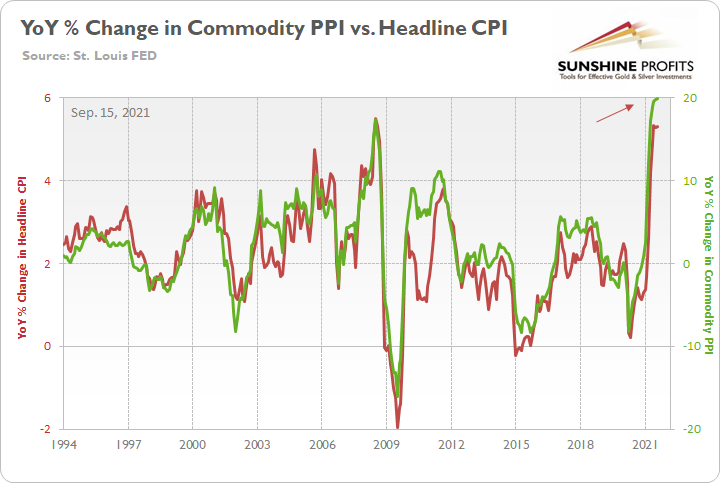
To explain, the green line above tracks the YoY percentage change in the commodity PPI, while the red line above tracks the YoY percentage change in the headline CPI. If you analyze the relationship, you can see that the pair have a close connection.
The bottom line? While the headline CPI remains pinned in the 5%+ range (expected) for now, the metric is still well above the Fed’s 2% annual target. What’s more, with the S&P Goldman Sachs Commodity Index (S&P GSCI) making new highs alongside Brent and WTI, the future impact on the commodity PPI should be material. And if the Fed doesn’t accelerate the liquidity drain and calm commodities’ fervor, we may see a 6% headline CPI print before we see 4%. Conversely, if companies can’t pass through the higher input inflation, the impact on corporate profit margins could upend the general stock market and leave the Fed handcuffed.
As a result, whether the Fed accelerates its taper timeline or margin pressures lead to a stock market correction, both outcomes are profoundly bullish for the U.S. dollar. And with the PMs exhibiting strong negative correlations with the greenback, they could suffer materially as the events unfold.
In conclusion, the PMs were mixed on Oct. 12. However, with the EUR/USD hitting a new 2021 low and the USD Index hitting a new 2021 high, the dollar’s medium-term outlook remains quite bright. Moreover, with the Fed upping the hawkish ante and an accelerated liquidity drain poised to chip away at the PMs, new lows should materialize over the next few months.
Related: Inflation Finally Meets Wall Street’s Ears! Is Gold Next?
The views and opinions expressed in this article are those of the contributor, and do not represent the views of IRIS Media Works and Advisorpedia. Readers should not consider statements made by the contributor as formal recommendations and should consult their financial advisor before making any investment decisions. To read our full disclosure, please click here.