
Monday, October 19th, 1987: Investors wake up to see global markets in slight disarray. The S&P had been at about the 300 level the week prior and, although there was a minor dip in the index at this time, investors believed because of the significant liquidity provided by the Federal Reserve during this time that the market would shrug it off. Below is a graphic provided by the Federal Reserve that describes the events before, during, and after the crash that sent US indices down over 20% in one day.
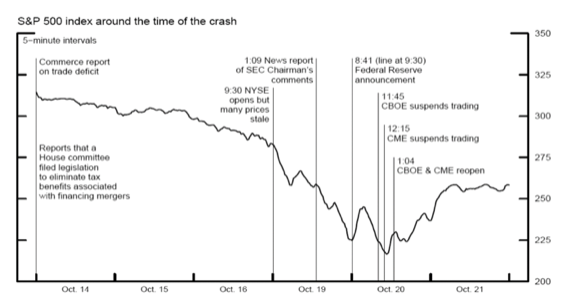
Source: A Brief History of the 1987 Market Crash, Federalreserve.gov
Mark Carlson, Senior Economic Project Manager of the Federal Reserve, wrote the white paper, A Brief History of the 1987 Market Crash, describing the events leading up to and following the fateful day. In the white paper, Carlson writes:
The Federal Reserve was active in providing highly visible liquidity support in an effort to bolster market functioning. In particular, the Federal Reserve eased short-term credit conditions by conducting more expansive open market operations at earlier-than-usual times, issuing public statements affirming its commitment to providing liquidity, and temporarily liberalizing the rules governing the lending of Treasury securities from its portfolio. The liquidity support was important by itself, but the public nature of the activities likely helped support market confidence. The Federal Reserve also encouraged the commercial banking system to extend liquidity support to other financial market participants. The response of the Federal Reserve was well received and was seen as important in helping financial markets return to more normal functioning.
This paragraph is eerily similar to today’s market. Now, with the easy liquidity, the excess open market operation by the Fed, and rock-bottom interest rates, leverage is at an all-time high.
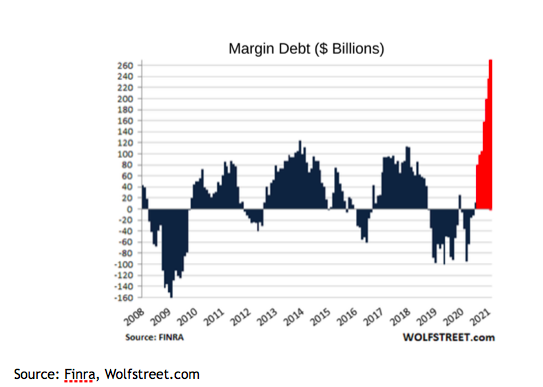
Why is this so dangerous? Simply because this can create a negative compounding effect where, as margin calls are made, more selling commences, triggering further more margin calls. This type of environment is often ripe for a sharp drop in the stock market.
Now, moving on to the flashing red warning light. The easy liquidity provided by the Federal Reserve has prompted a significant uptick in inflation. With this, the market has responded, as we have seen the 10 year treasury yield rise nearly 400% from its bottom in 2020 to about 1.75 this week. Sure, this is important because it gives investors more incentive to move out of equities and into bonds, now that the yields have risen. But what is really important is the speed at which the 10 year yield has risen, a speed we have not seen since when? Ding ding! You guessed it. The week before Black Monday in 1987.
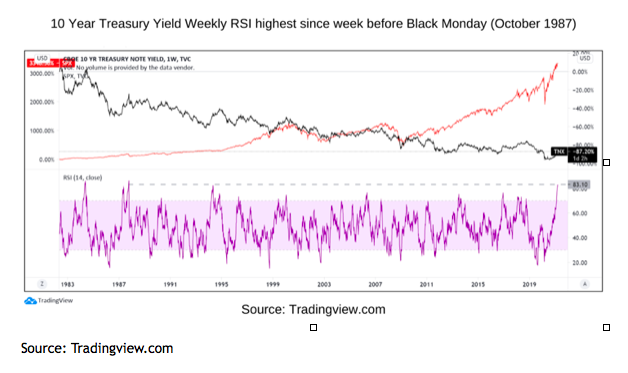
This graph shows the 10 year treasury yield (black), the S&P 500 (red), and the 10 year treasury yield weekly relative strength index (purple). Relative strength index is a momentum indicator that provides investors with an idea of the strength of a security’s price move. Amazingly, the 10 year treasury’s RSI has not been this high since the week before Black Monday. In other words, in the last three decades we have not seen it this high.
I am not saying that a crash will happen; I am simply saying that there are notable similarities in this market to that of October 1987.
Related: Diversification, Sector Rotation, and Major League Baseball