
Written by: Meera Pandit
"S&P 500 valuations have soared to 22 times currently, compared to 12.9 times in the corresponding post financial crisis period."
Comparing the recoveries of the global financial crisis (GFC) and the pandemic recession is like comparing the tortoise and the hare: the aftermath of the former was slow and steady, while the latter should experience a burst of speed ahead. The difference in the potential strength and speed of the recovery can be attributed to three factors:
- Supply vs. demand-driven recession – The financial crisis was a demand-driven recession, in which housing and financial market excesses led the economy to overheat and collapse, destroying demand, and therefore growth and employment, in the years that followed. The COVID recession shocked a healthy economy in which demand was still strong, but supply was then reduced (e.g. activity or capacity restrictions). Once that supply returns (activity normalizes in a post-vaccine world), pent-up demand can be realized.
- Goods vs. services – After the GFC, consumers weren’t purchasing big-ticket items, like homes or cars. They were, however, still using services. This time around, consumers shifted their spending online, housing boomed, and auto sales recovered quickly. Goods consumption is 7% above pre-pandemic levels, while services is still down 5%. Because consumption of services is double that of goods and dominates employment, this has been a particular challenge in the pandemic, but should be a significant tailwind post-pandemic.
- Fiscal and monetary policy support – Policy support has been swifter and much greater. While in both cases the Federal Reserve (Fed) cut rates to zero almost immediately, credit was tight after the GFC, while lending and access to credit has remained robust throughout the pandemic. Also, this round of quantitative easing (QE4) is now nearly larger than QE1-QE3 combined, almost doubling the Fed’s balance sheet.
Meanwhile, the federal government passed the CARES Act and three smaller bills to the tune of 2.4 trillion USD to support households and businesses. This was supplemented by a 900 billion USD fiscal package passed in late December, and will likely be further augmented by a $1.9 trillion pandemic relief package. With a total price tag of 5.2 trillion USD and 25% of 2020 nominal GDP, this dwarfs the 831 billion USD American Recovery and Reinvestment Act of 2009, which was just 5.8% of 2009 nominal GDP.
From an investment standpoint, massive policy support propelled one of the fastest market recoveries on record. S&P 500 valuations have soared to 22.0x currently, compared to 12.9x in the corresponding post-GFC period. Although the improving backdrop should support markets in the months ahead, high valuations may constrain long-term returns. Investors should seek attractive relative valuations and beneficiaries of the cyclical recovery, like in value stocks and international equities.
Fiscal stimulus as share of nominal GDP
Percent, billions
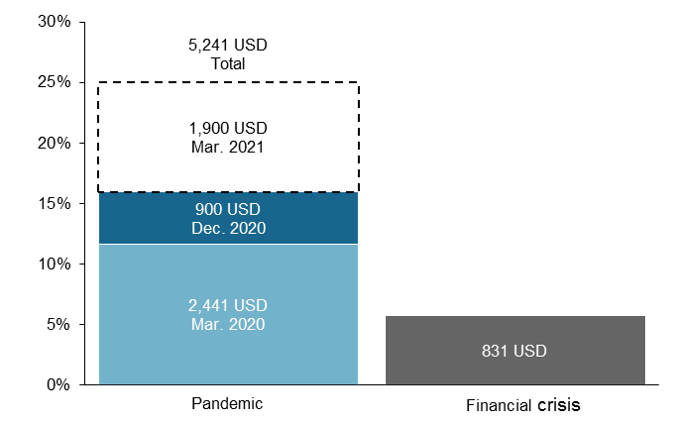
Source: BEA, CBO, U.S. Government, J.P. Morgan Asset Management. March 2020 includes CPRSA, FFCR, CARES and PPPHCE Acts, signed into law on March 6, 18 and 27 and April 24 as estimated by CBO. Share of 2009 and 2020 nominal GDP. Data are as of February 22, 2021.
Related: Is a Market Correction Coming?