
Trending

The following headline from a July 2020 CNBC article is stunning: Here’s why economists don’t expect trillions of dollars in economic stimulus to create inflation.
In hindsight, so many economists could not have been more wrong in 2020 about the path of inflation. Today, despite their spurious track record, scores of economists exude confidence in their forecasts for a sustained rate of higher-than-average inflation and a soft economic landing.
Because of their terrible forecasting errors in 2020, let’s review the CNBC article and find the flaw in their logic. The value of this exercise is not to put economists down. Instead, it helps us better appreciate their current logic and how much credence we should put into their projections.
Background July 2020
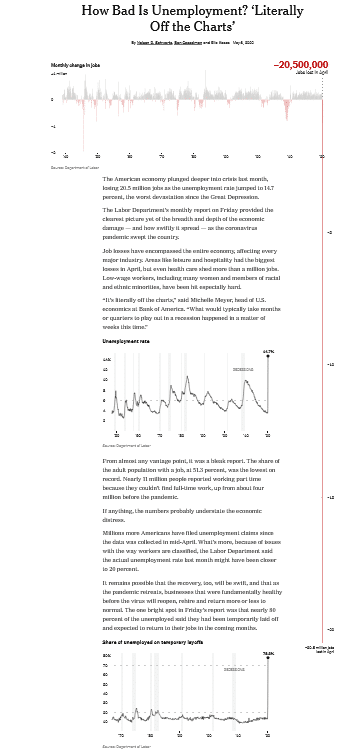
The fiscal and monetary responses to the COVID pandemic were enormous. The economy was essentially shut down and collapsing at a speed unwitnessed in American history. Even three and half years removed from the onset of COVID, the New York Times headline and graphic below, detailing the unprecedented loss of jobs, is still remarkable.
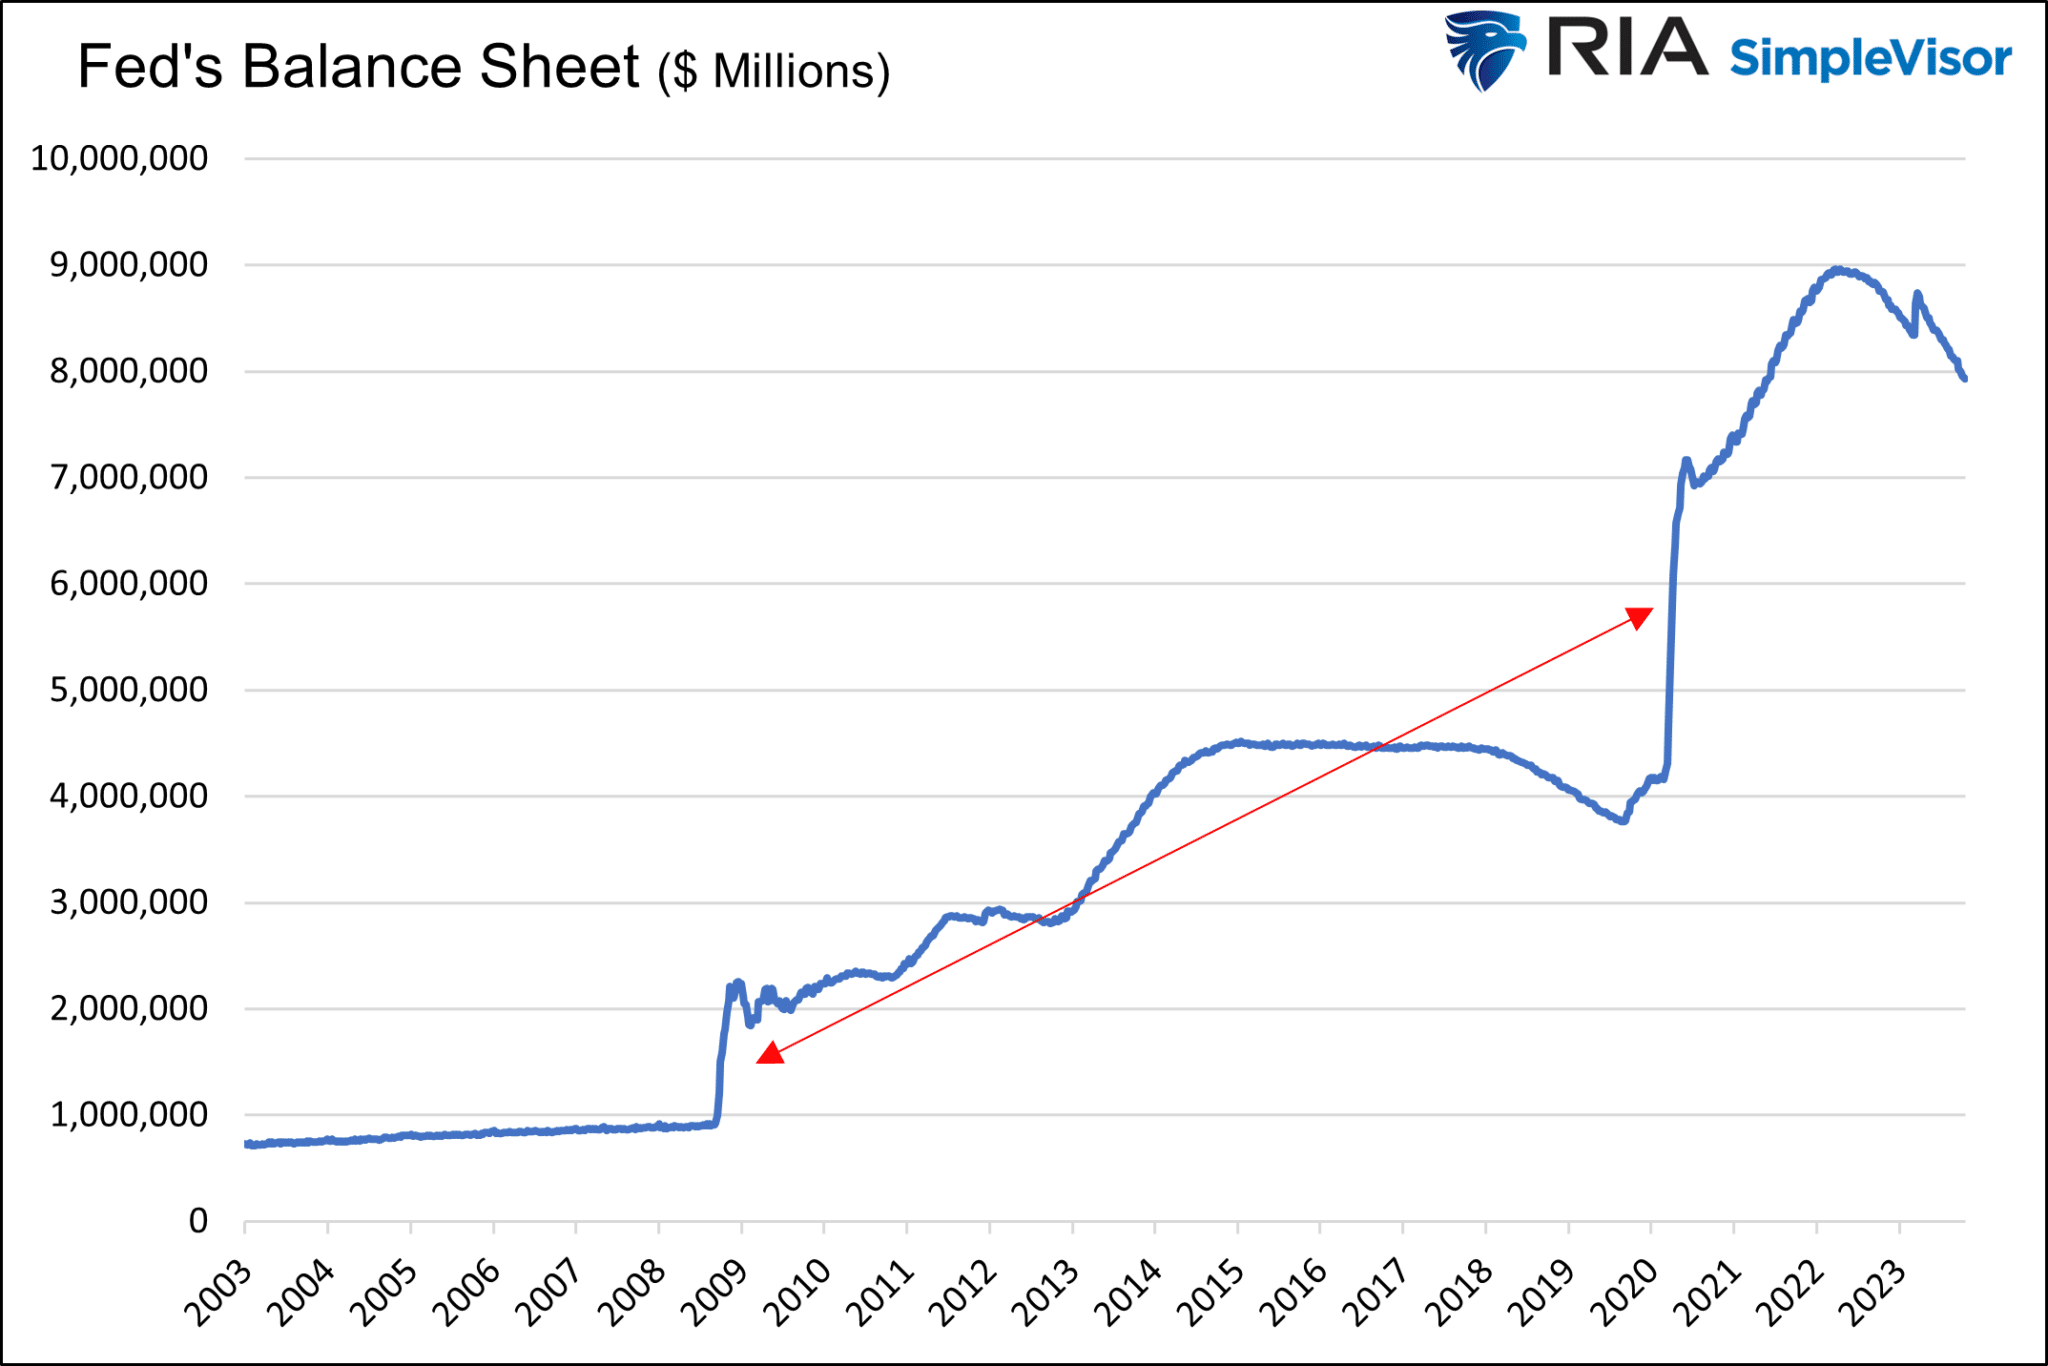
Within six months of the pandemic’s start, the Federal Reserve grew its balance sheet by $2.8 trillion and cut the Fed Funds rate from 1.50% to 0%. For context, the Fed’s balance sheet growth in the first half of 2020 was $1.6 trillion more than the emergency QE1 conducted in 2008.
The Fed’s actions were meant to support failing financial markets but even more so to allow the government to borrow as much money as it wanted and at meager interest rates.
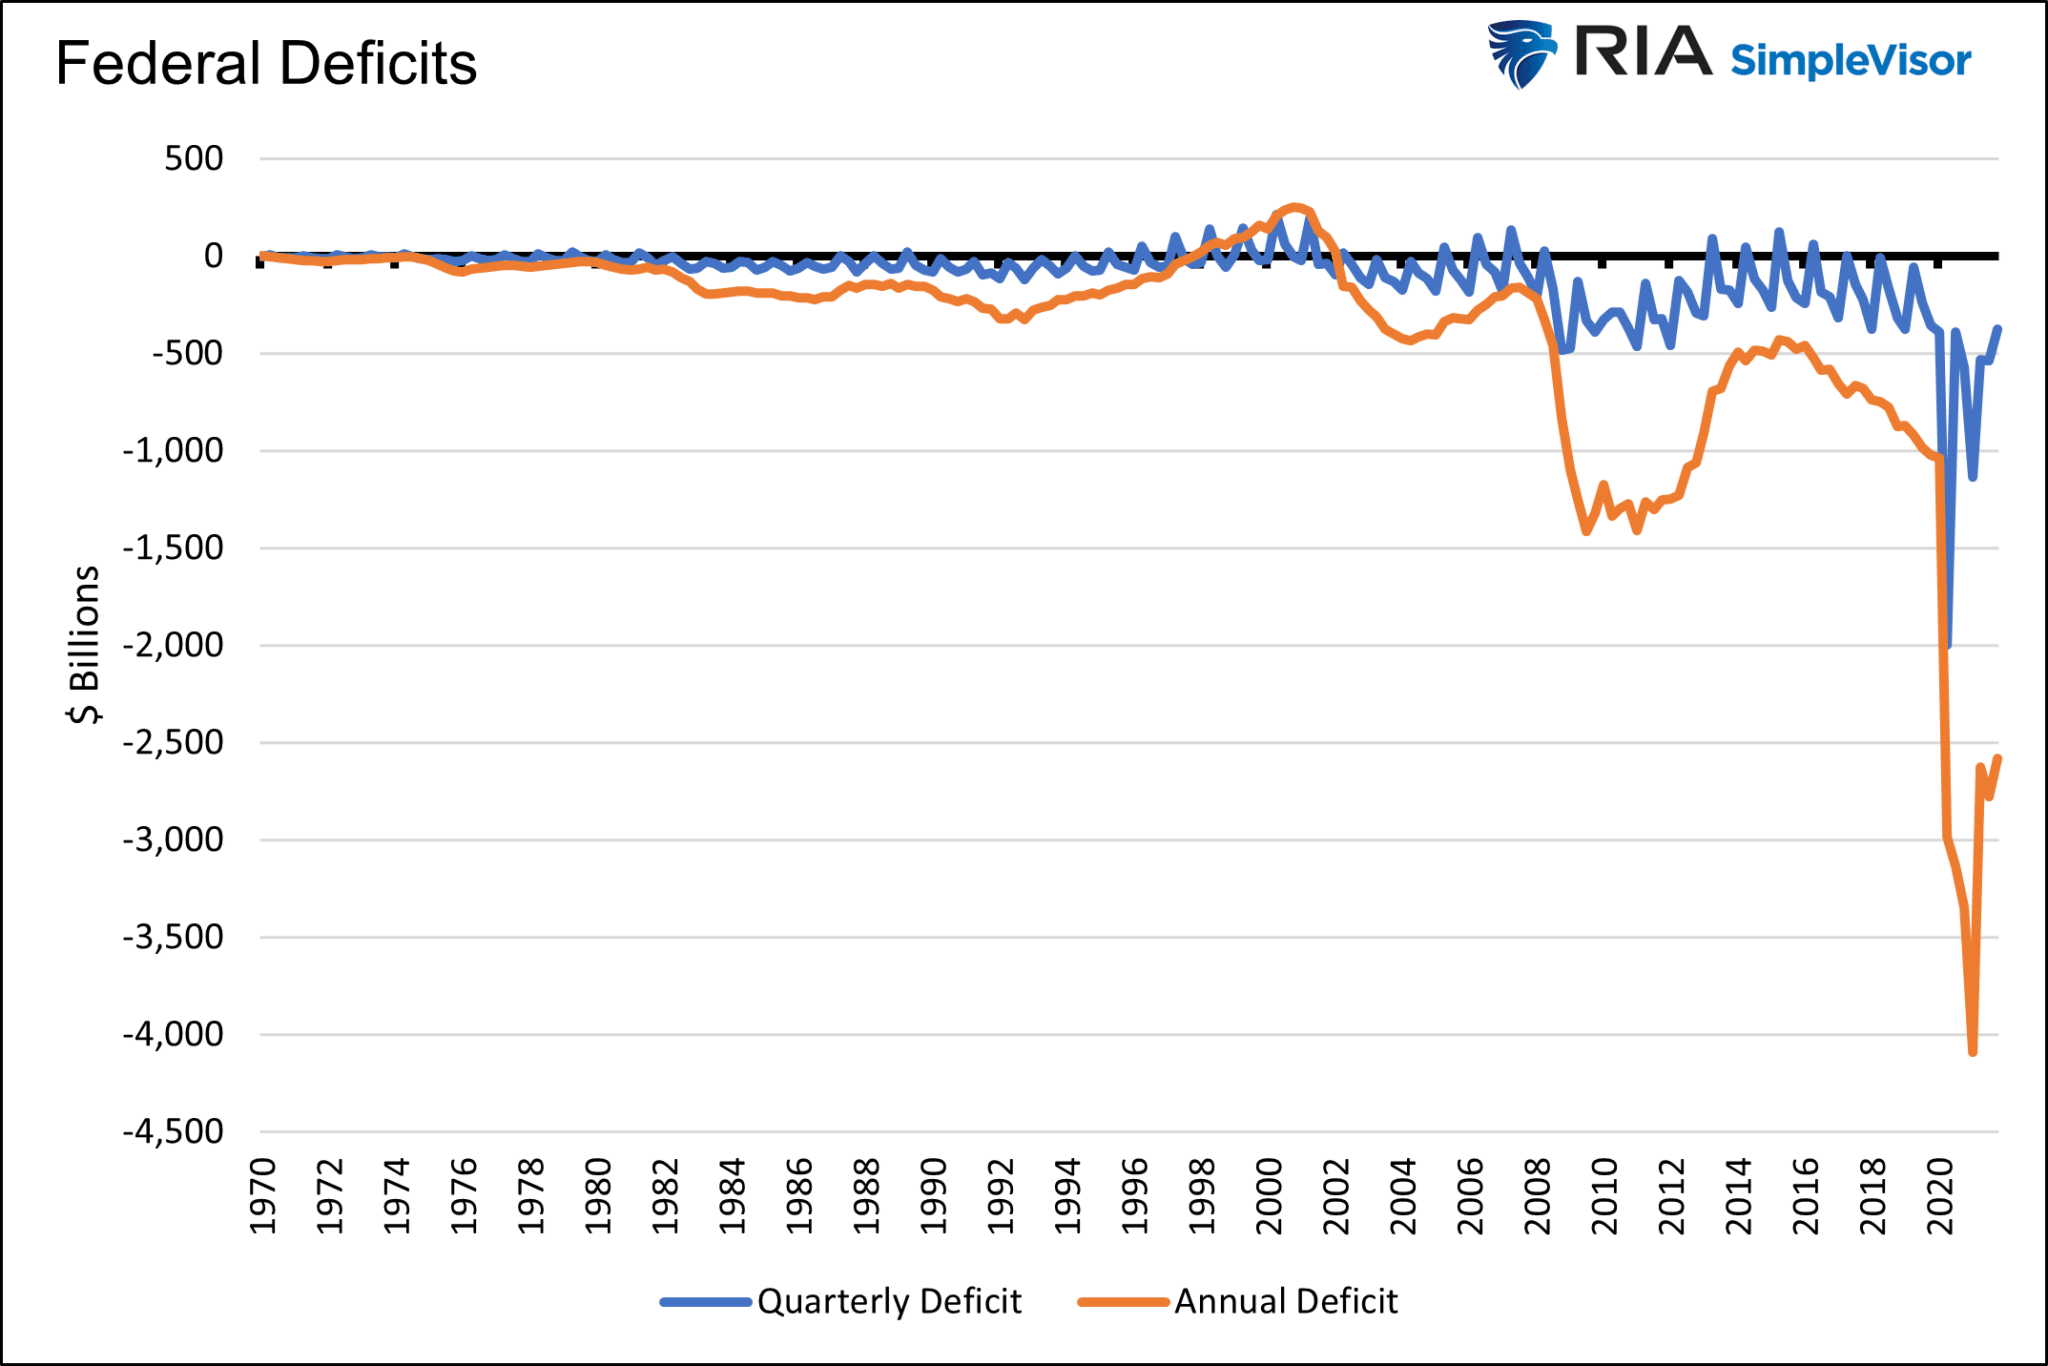
As shown below, the second quarter 2020 deficit was $2 trillion, or over $500 billion more than the annual deficit used to combat the financial crisis. All other quarterly deficits pale in comparison.
Despite the massive fiscal and monetary onslaught and a severe breakdown in supply lines and the production of most goods, many Wall Street economists were sanguine about inflation prospects.
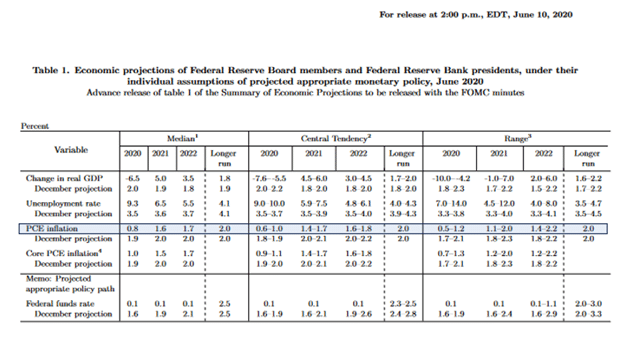
The Fed was not worried either. As a result, on June 10, 2020, the Fed’s outlook for inflation was 0.8% for the remainder of the year, 1.6% for 2021, and 1.7% for 2022. Over the longer run, they expected inflation to settle in at 2%. As we highlight below, of the 16 FOMC members surveyed, the highest estimate for inflation over multiple future periods was 2.20%. Unfortunately, PCE inflation ultimately peaked at 7.11%!
2020 Logic
The following comes from the article:
Supply shocks have driven up prices for some goods in recent months. Yet many economists expect consumer prices will stay low despite trillions of dollars in government stimulus.
“While there certainly is quite a lot of disruption to the supply side of the economy, that’s likely to be dominated by the huge hit to aggregate demand,” said Evercore ISI Vice Chairman Krishna Guha.
Krishna Guha sums up a popular opinion among economists at the time and one on which the Fed based monetary policy. Despite the sizeable stimulus and enormous supply-side disruptions, price increases would apparently be muted due to the “huge hit to aggregate demand.”
Economists chose to ignore everything except demand. They feared the velocity of money was declining at such a rapid pace it would offset the stimulus, supply line problems, and the unprecedented increase in the money supply.
Monetary velocity measures how often money circulates in an economy. Therefore, the more velocity, the more demand for goods and services.
To expect little inflation, they must have assumed consumers would save the stimulus money for a long time.
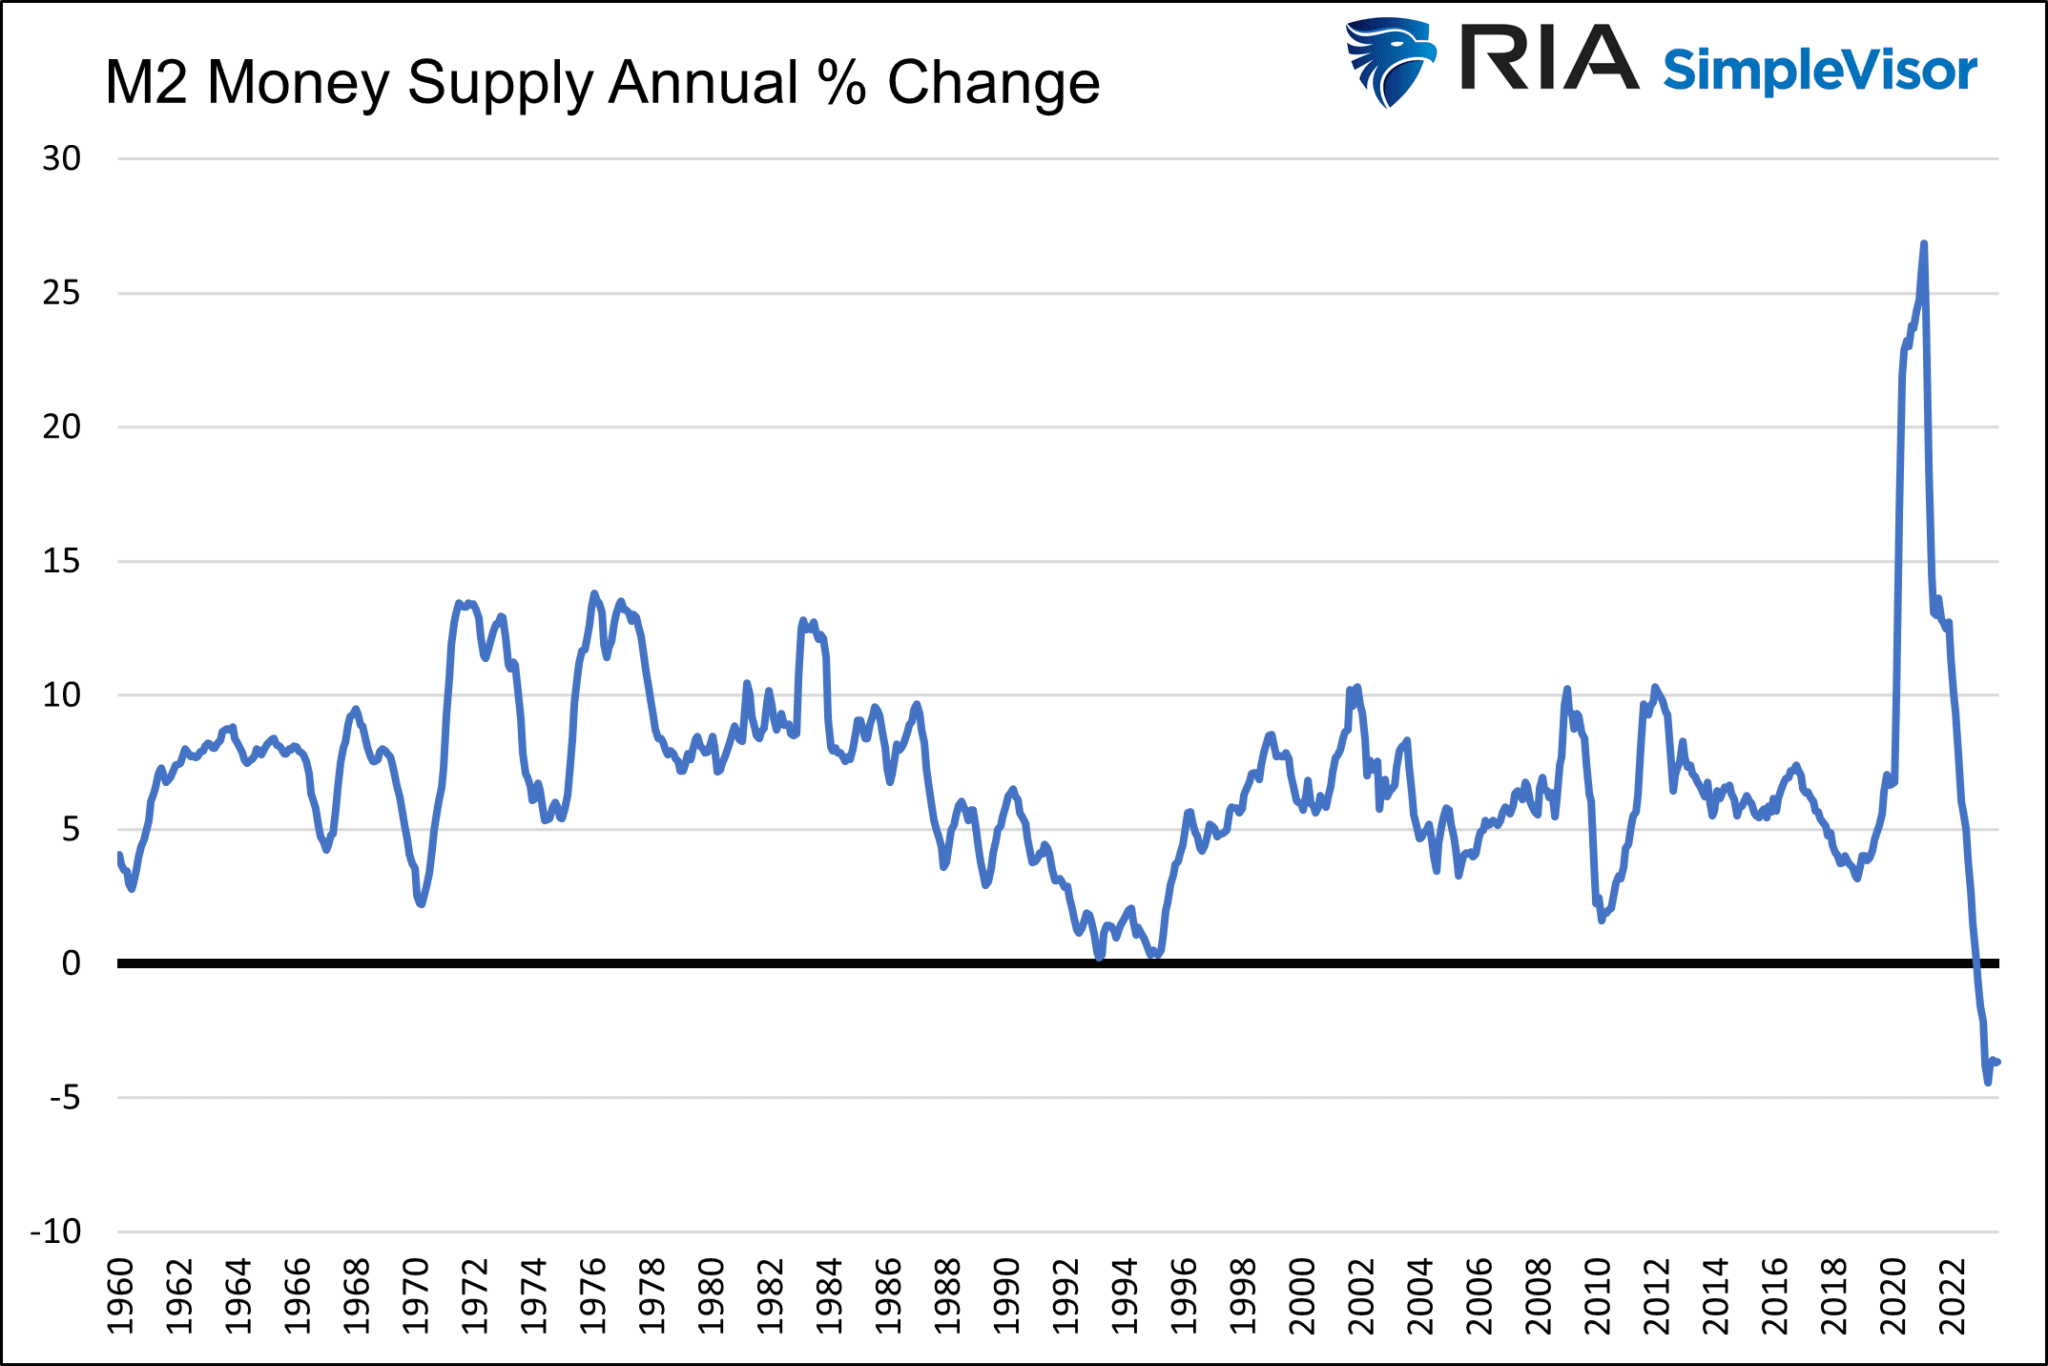
The graph below shows the massive surge in the money supply and the recent decline. The increase was unprecedented, as is the current decline.
Velocity Was Misjudged
Per the article:
“At this stage, even with the Fed doing as much as it can, it’s still not leading to an enormous increase in demand,” Olivier Blanchard, a senior fellow at the Peterson Institute for International Economics- CNBC.
Blanchard goes on to say that the $1,200 stimulus checks from the federal government were not extensive enough to stoke inflation.
Despite limitations on what they could spend on, consumers ramped up their spending.
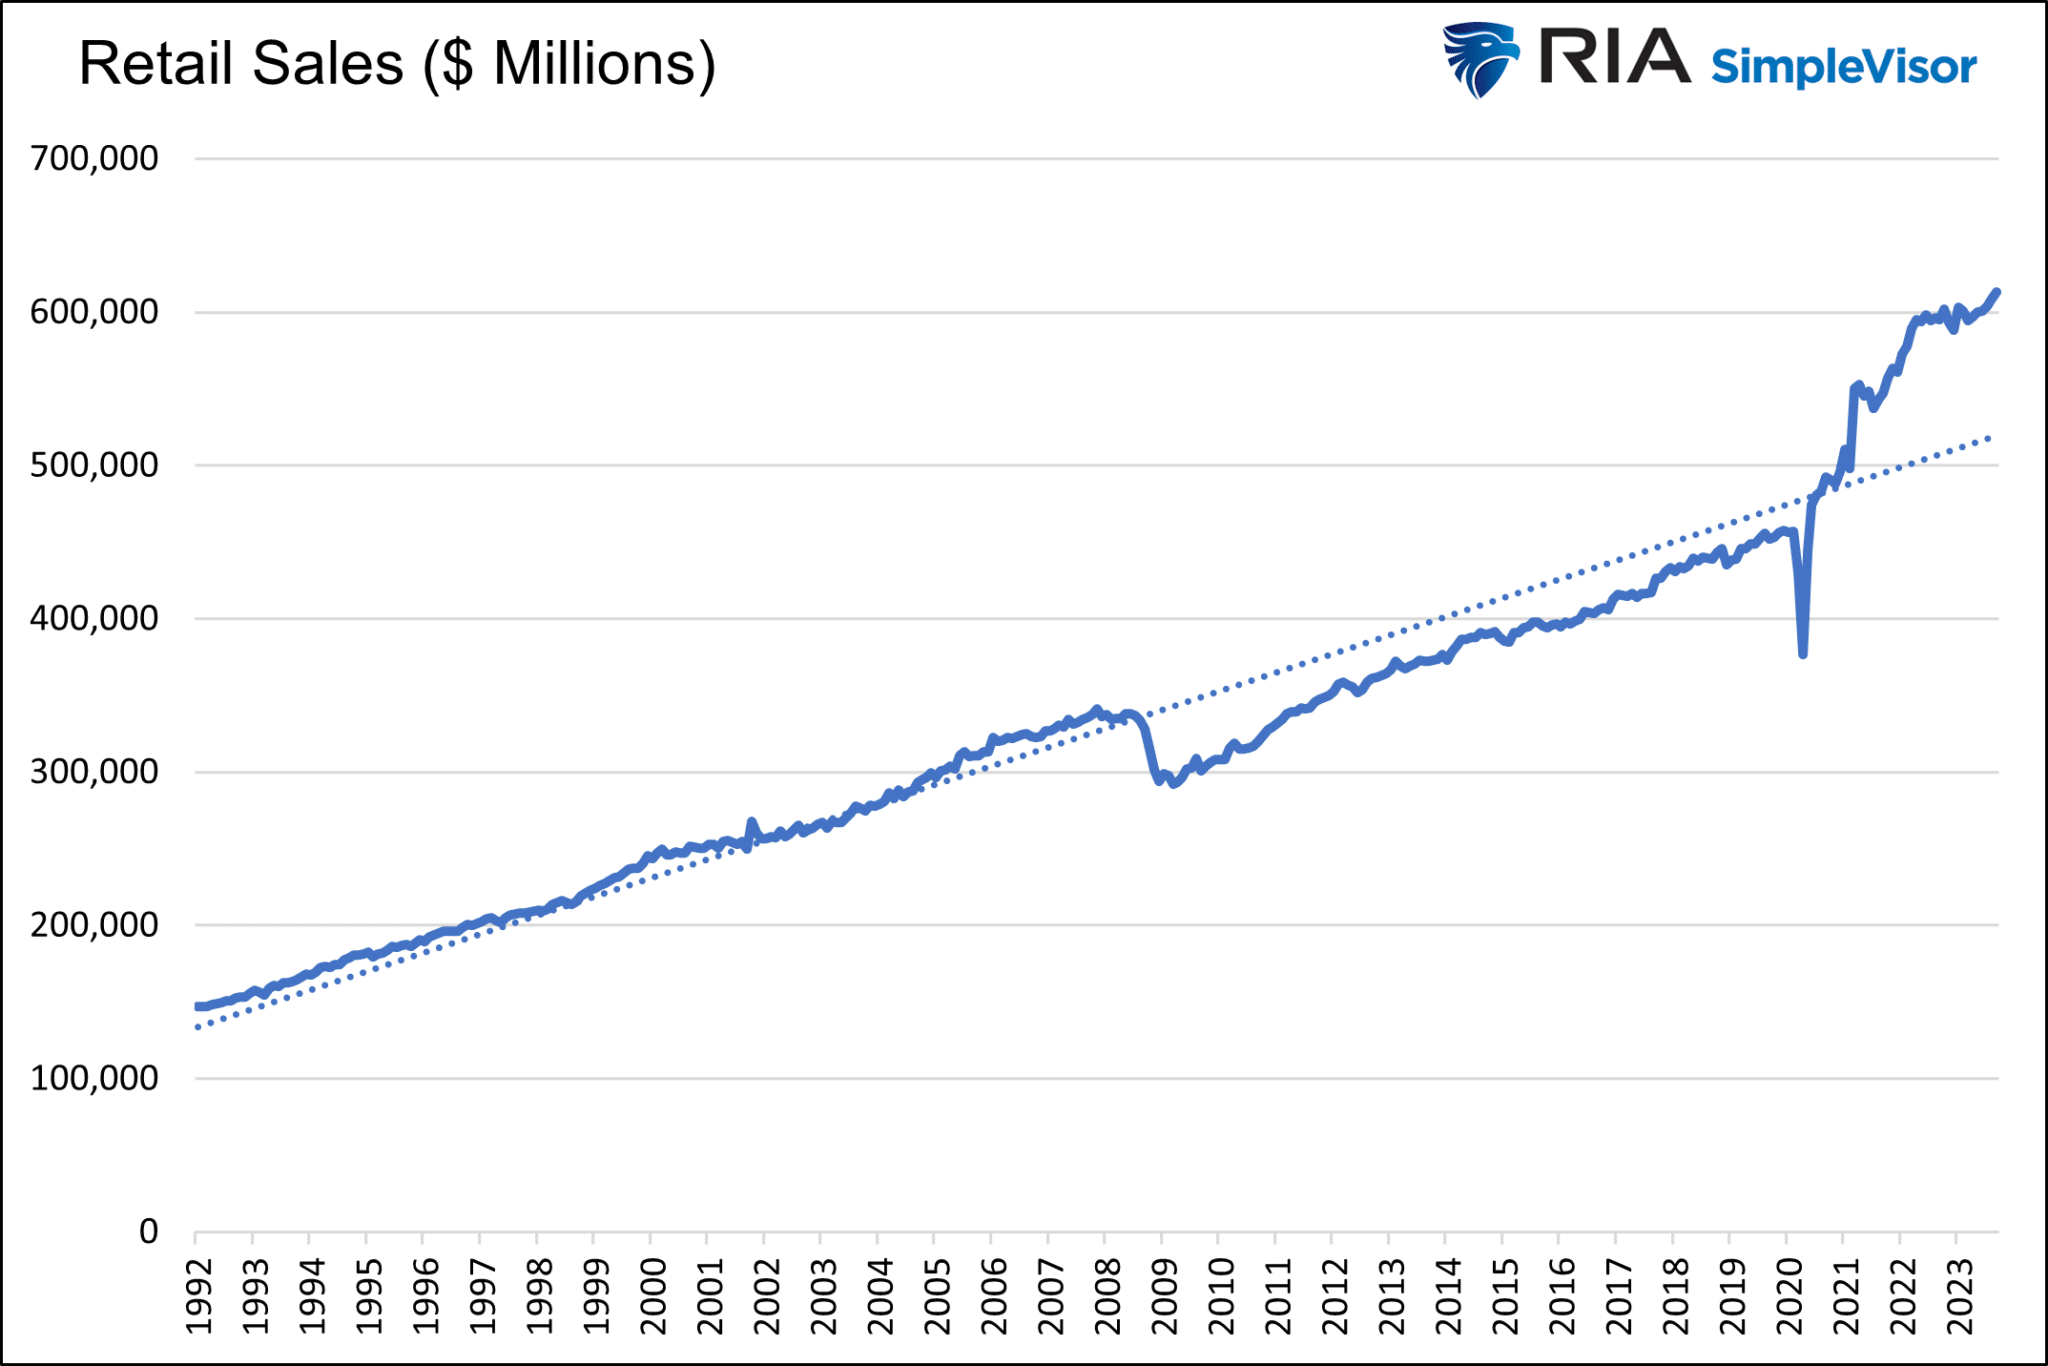
The graph below shows the initial COVID-induced plummet in retail sales. However, a rapid catch-up quickly followed. More importantly, spending continued much faster than the pre-pandemic trend.
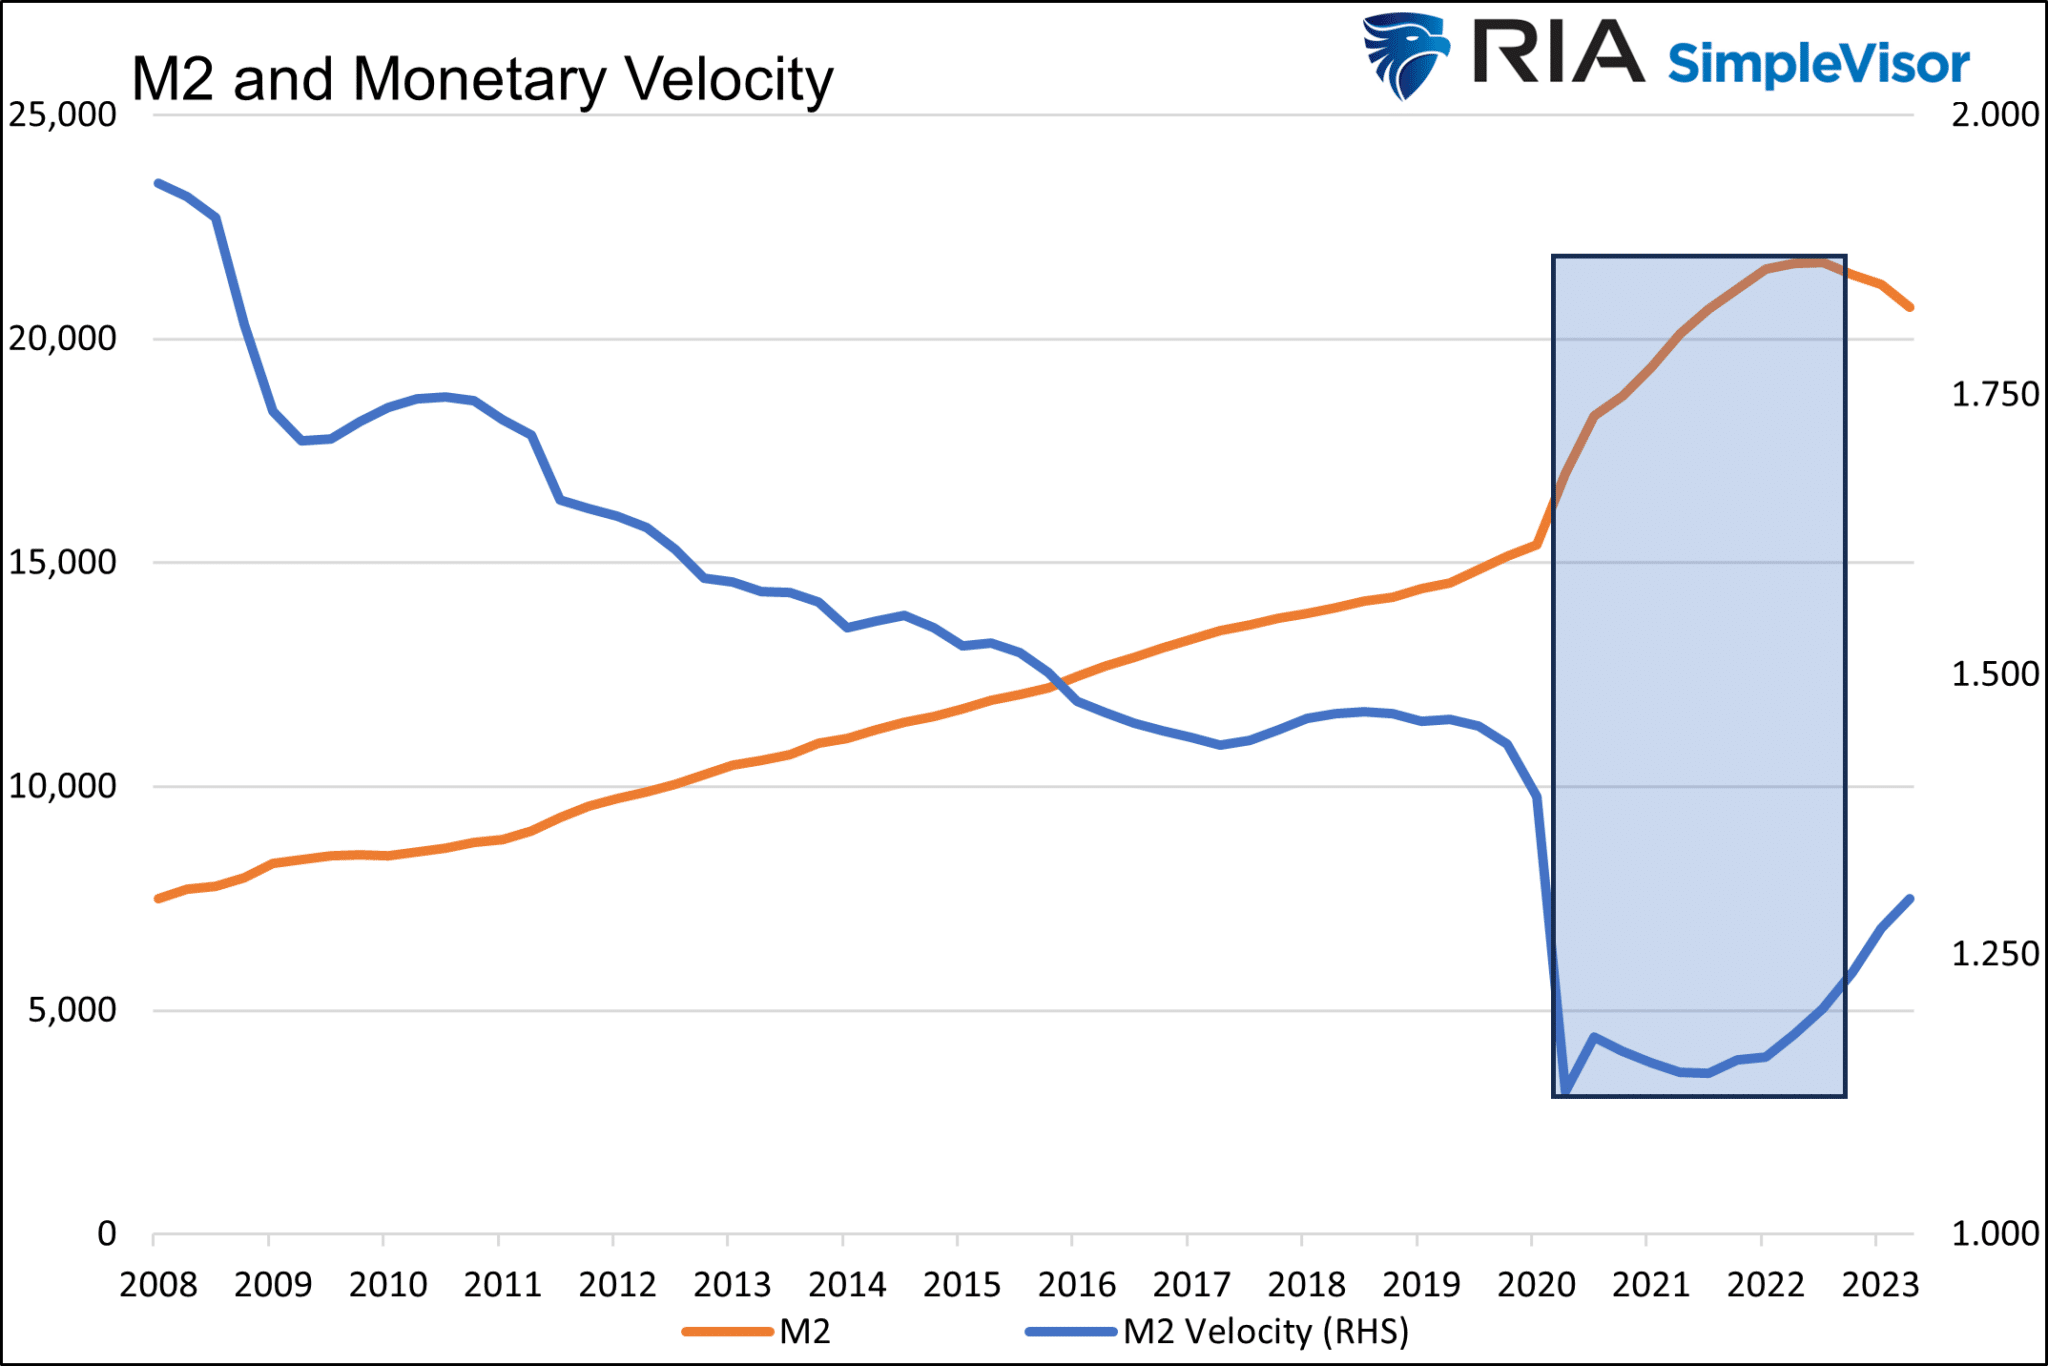
Economists ignored tremendous amounts of data pointing to growing inflationary pressures and wrongly predicted a continued decline in monetary velocity. Hence, the colossal underestimate of inflation in mid-2020. The highlighted box in the following graph shows that velocity initially tumbled but quickly stabilized and slowly started rising. Its recovery occurred as the money supply was still increasing.
Review 2020’s Inflation Factors
Before considering today’s situation, let’s summarize the environment of July 2020
- Money supply up 20% year to date – Inflationary
- Monetary velocity down 18% year to date – Disinflationary/Deflationary
- Fed Balance Sheet up 66% year to date – Inflationary
- Fed Funds down from 1.50% to 0.00% – Inflationary
- Government deficit January through July $2.45 Trillion – Inflationary
- Supply lines and means of production broken – Inflationary
- Personal Savings rate rose 468% – Inflationary
- Crude oil fell below $0 in April – Inflationary (prices could only rise)
Monetary Velocity, a proxy for aggregate demand, was weak for a short period, but virtually everything else happening in the economy was inflationary. Once it stabilized, inflation took off.
Current Situation
Let’s start by bringing the inflationary factors above up to date (October 2023).
- Money supply down 2.25% year to date – Disinflationary/Deflationary
- Monetary velocity up 5% year to date – Inflationary
- Fed Balance Sheet down 7% year to date – Disinflationary/Deflationary
- Fed Funds at 5.33% – Disinflationary/Deflationary
- Government deficit Jan. through July $1.20 Trillion – Less inflationary
- Supply lines and means of production fully healed – No marginal effect
- Personal Savings fell 9% year to date – Disinflationary/Deflationary
- Crude oil hovering around $85, $20 above the 5-year average – Disinflationary/Deflationary (prices more likely to revert to average)
It is now three and half years after the pandemic shock, and almost all the factors above have become disinflationary or deflationary. However, there is one outlier- monetary velocity. It is currently inflationary.
Velocity Is Not All That Matters
Once again, the sole focus of economists and the Federal Reserve continues to be on aggregate demand. This time, however, they think it continues to stay red hot.
Can it continue? The base case for inflation to remain higher than the Fed’s 2% objective and a soft landing is to assume it does.
The problem with such a hypothesis is that the U.S. economy’s growth and the financial system’s health depend highly on debt growth. Credit drives our economy, and the health of the economy drives consumer spending.
While the money supply has fallen for ten consecutive months, a feat not accomplished since the Depression, it is still moderately above pre-pandemic levels. For the economy to grow over extended periods, money supply growth must keep up with economic growth.
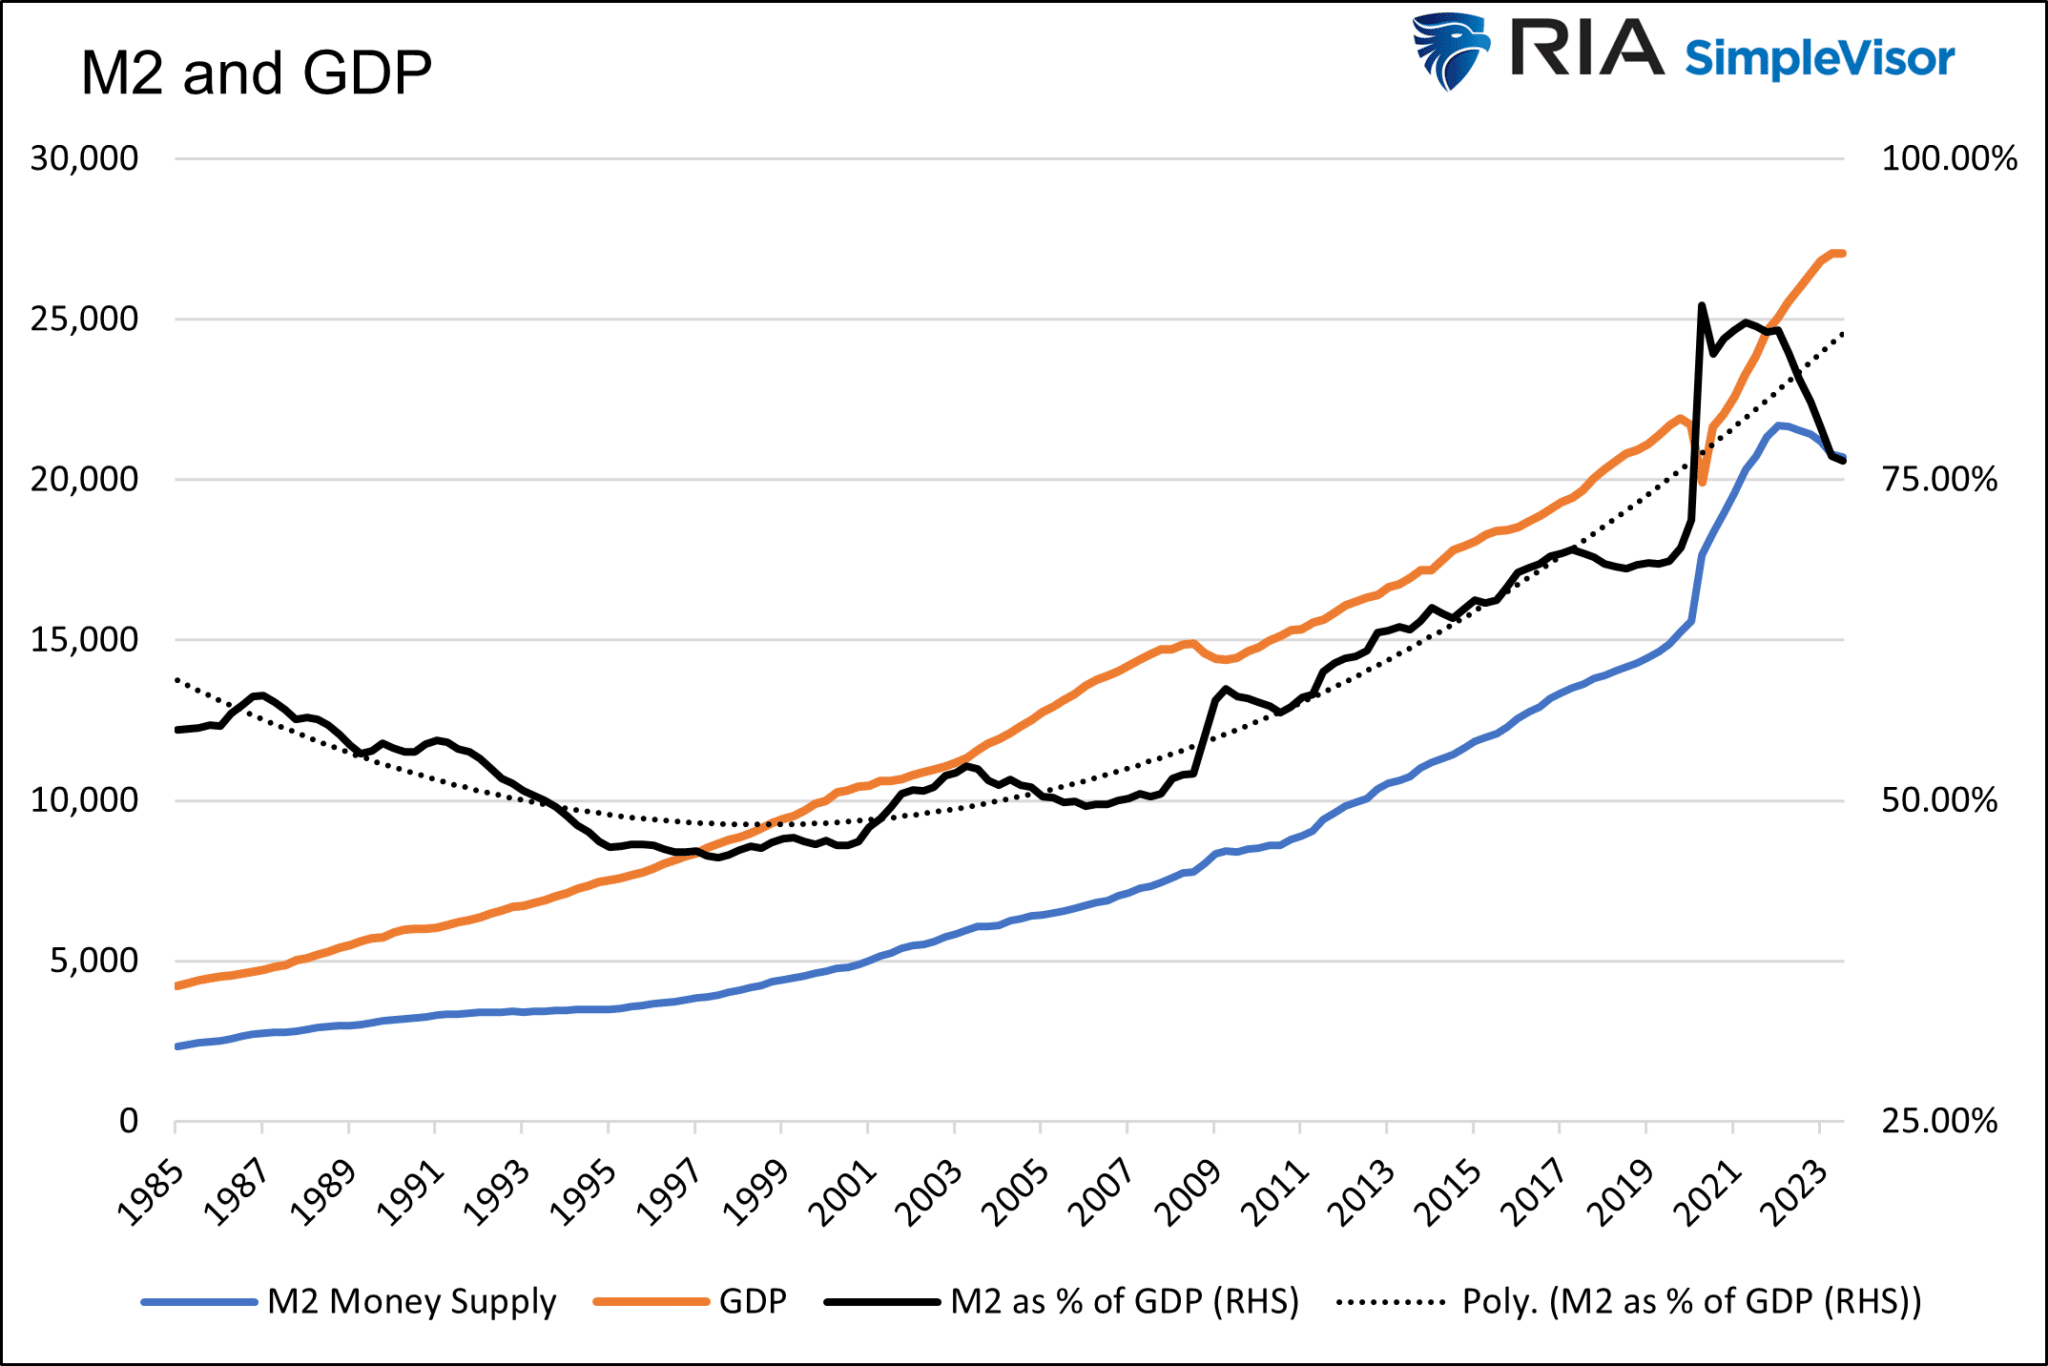
That aspect makes the graph below concerning. The solid black line is the ratio of M2 to nominal GDP. The dotted line shows its trend. While the ratio is above pre-pandemic levels, it’s well below the trend. Since 2000, when the ratio was below trend, a recession ultimately occurred.
Barring renewed growth in M2, which entails lower rates, a steeper yield curve, and the cessation of QT, a recession is likely.
With a recession, unemployment will rise, wage growth will falter, and consumers will cut back on spending.
The only question in our mind is when.
Summary
Might economists and the Fed be making the same mistake as in 2020: too heavy of a reliance on demand and insufficient consideration for other price factors?
In July of 2020, it was hard to imagine that consumers would spend at the rates they ultimately did. Today, consumers seem to continue to spend despite whatever the Fed does to slow the economy.
It’s easy to get caught up in recent trends and believe they can continue for long periods. Consequently, it’s hard to imagine how they end.
Given the likelihood that economists are again myopic in their inflation forecasts and bond traders are betting on such projections, we see a day soon when a disinflationary or deflationary reality hits the bond market and bond yields plummet.
Related: Why Target Date Funds Fail Investors: A $3 Trillion Delusion