
Trending

Written by: Steph Gan | Seafarer Capital Partners, LLC
Given recent market volatility, financial advisors reducing their clients’ exposures to U.S equities[i] may be evaluating an allocation to emerging market (EM) stocks. However, achieving thorough, well-balanced exposure to the EM remains challenging: many index-based products follow formulations that prize scale and replicability over comprehensiveness. Seafarer Capital Partners has analyzed the emerging markets indices favored by mainstream passive products to better understand the trade-offs. Below is a summary of some key findings.
Benchmarking Challenges in the Emerging Markets
Building a benchmark that spans 27 developing countries with varying liquidity levels, regulations and laws can be challenging. This is apparent in the asset class’s low index representation relative to U.S. equities: only 24% of EM market capitalization is reflected in the MSCI Emerging Markets Index[ii], compared with 79% of U.S. capitalization in the MSCI USA index.[iii] This significant difference illustrates the difficulty in accessing emerging markets companies. Acquiring approval to trade local shares can be tedious, and many regulators place caps on the proportion of companies’ shares that can be owned by foreign investors.
EM index designers can choose between two approaches for optimizing an equity index. One approach is building an index that achieves the highest representation of emerging market companies, but that may be difficult for investment managers to replicate at scale. The other is constructing a highly liquid and cost-efficient benchmark that managers can adopt easily, but that minimizes exposure to less accessible companies.
On this matter, MSCI has emphasized that its indices strive for balance, replicability, and investability.[iv] Replicability and investability imply that an outside investor can adopt the benchmark without facing limitations related to available float, liquidity, or legal and regulatory constraints. To this end, most prominent index makers (such as MSCI and FTSE) have constructed filters to eliminate or severely reduce exposure to equities that they deem are not meeting these requirements at scale.
EM Benchmarks Favor Large Capitalization Companies
In the prioritization of scalability and replicability, what indices exclude are mostly mid and smaller-cap companies. The MSCI EM is a free float-based index, which means the largest exposures come from companies and economies that have had strong historical performance. Relatively “advanced” markets such as South Korea and Taiwan have higher index weights than their actual market capitalizations merit. Likewise, a free-float index has less weighting in burgeoning companies that are early in their growth trajectories because of the index tilt toward well-established companies.
What may surprise advisors is that a large-capitalization bias also impacts industry representation. Our research shows that large-capitalization stocks are prevalent in certain industries where scale matters – such as financials, information technology, and communications services. For other sectors, scale matters less than company-specific factors such as effective distribution and branding strategies. Healthcare, industrials, and consumer staples are examples of the latter group that see a larger proportion of small-cap companies. The table below shows that compared to the broader EM equity universe, a leading EM index is overweight several scale-dependent sectors and underweight small cap-friendly ones.
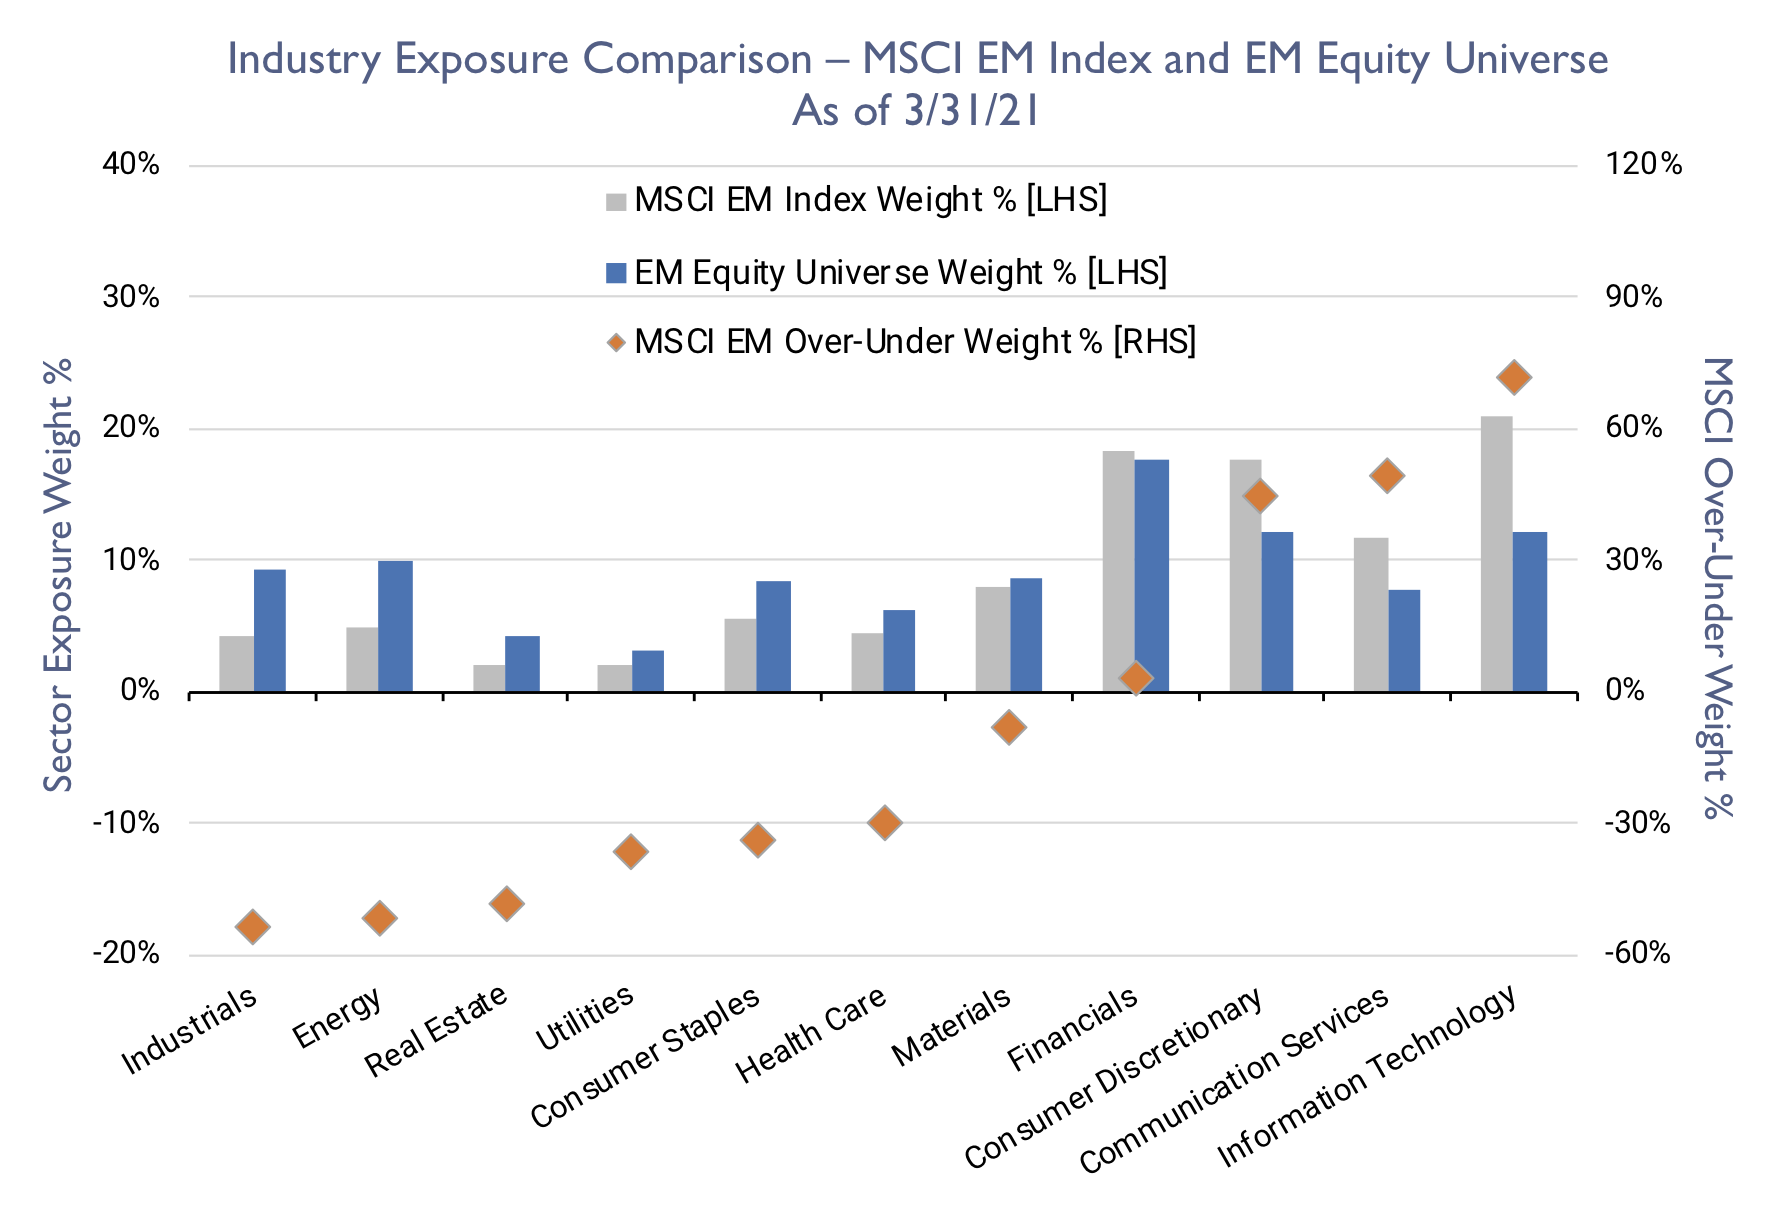
Sources: MSCI, Seafarer, Bloomberg.
Index Concentrations
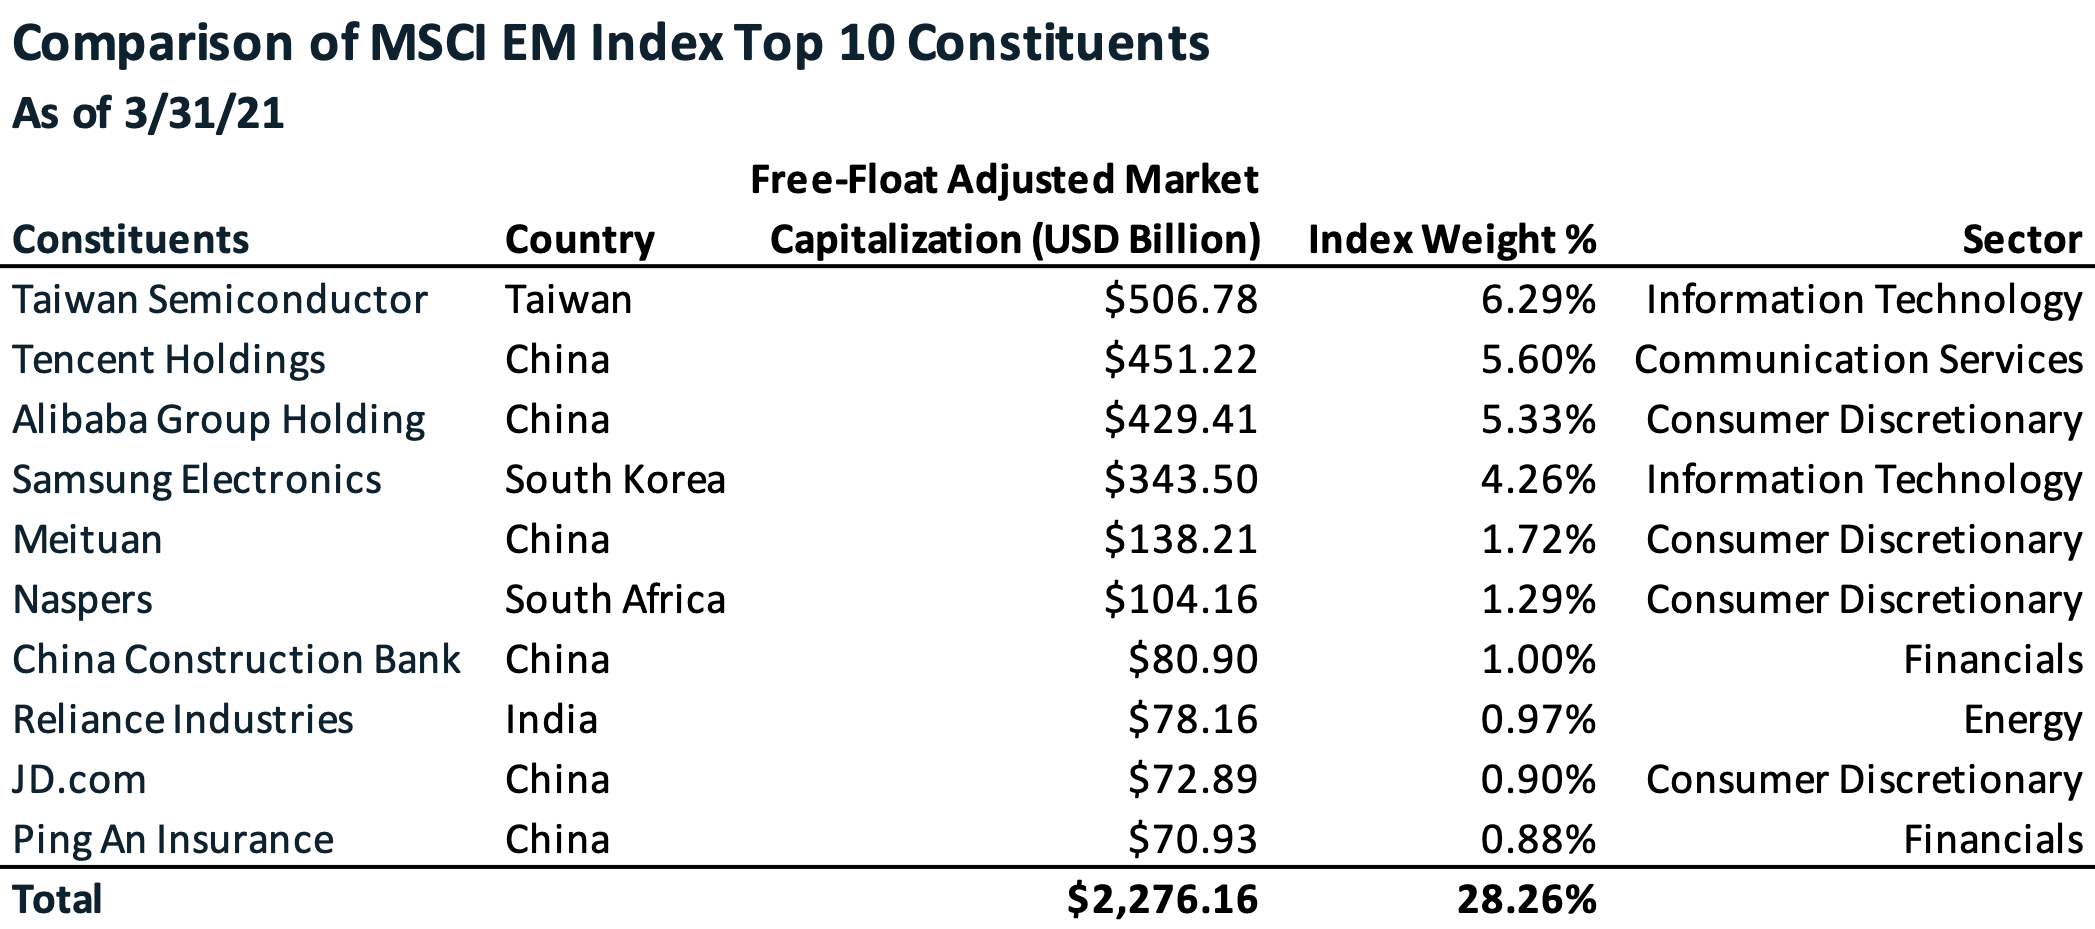
Finally, advisors who have been concerned about the concentration of U.S. equity indices in large-cap Internet and technology stocks may be struck by how emerging market indices are subject to the same concentration problem to a greater degree. As of March 31, 2021, seven of the top ten MSCI EM Index constituents can be classified as either belonging to the information technology or Internet sectors.[v]
In summary, much has been written about the trend of increasing concentration within the S&P 500 index[vi], but advisors should be aware that a similar phenomenon exists in the emerging markets, with additional distortions coming from filters for ease of foreigner access. Passive emerging market investors may be hoping to achieve representative exposure to certain economic development profiles. However, index construction requirements (especially for replicability at scale) also have a hand in determining the end exposures. These findings suggest that advisors should be mindful of the limitations of passive exposure when investing for growth opportunity and representativeness.
[i] Source: MSCI. Data as of March 31, 2021.
[ii] Randy Watts, “How Long Will The Value Rotation Last?” (https://www.forbes.com/sites/randywatts/2021/04/28/how-long-will-the-value-rotation-last/) Forbes, April 28, 2021.
[iii] Sources: Bloomberg, Seafarer. Data as of March 31, 2021. Universe is defined as companies domiciled in one of 27 emerging market countries, with a market capitalization of at least $100 million.
[iv] Sources: Bloomberg, MSCI, Seafarer.
[v] “MSCI Global Investable Market Indexes Methodology” (https://www.msci.com/eqb/methodology/meth_docs/MSCI_GIMIMethodology_May2019.pdf) MSCI, May 2019.
[vi] John Rekenthaler, “The S&P 500 Grows Ever More Concentrated” (https://www.morningstar.com/articles/992504/the-sp-500-grows-ever-more-concentrated) Morningstar, July 20, 2020.