
Written by: MacKay Global Fixed Income | New York Life Investments
The year 2022 proved to be a year of a great reset for fixed income aficionados. Bond prices are sharply lower and yields are meaningfully higher. Following a nearly 15 year period of ultra-low interest rates that starved pensions and retirement savers of needed income, the opportunities to earn yield are plentiful. Despite all the global headwinds, we maintain the opportunities in fixed income far exceed the risks of sitting on the sidelines. We fervently believe bonds are back and 2023 will be the “Year of the Bond.”
1. Income dominates total return
This year’s bond market return has captured an unfavorable distinction as the worst returns in the history of the bond markets (see Figure 1). There are two primary components of a bond’s return: income and price appreciation. Following a hawkish Federal Reserve that has led to a series of interest rate hikes, the U.S. bond markets have seen a significant move higher in yields. In our view, the income component of total return is at its most attractive level since the depths of the COVID-led recession, but with far better fundamentals. As represented by the Bloomberg U.S. Aggregate Index, the average yield for U.S. investment grade assets stands at approximately 5% (as of October 31, 2022). High quality public fixed income is once again one of the most attractive asset classes for yield-seeking investors while providing better liquidity than the private markets. The other component of a bond’s return is its potential for price appreciation. Even without a Fed pivot, 2022’s market correction has discounted bond prices meaningfully. Since discount bonds typically accrete to par, the market has created room for attractive price appreciation potential for investors.
Figure 1: Year-to-date total return for the Bloomberg Global Aggregate Index
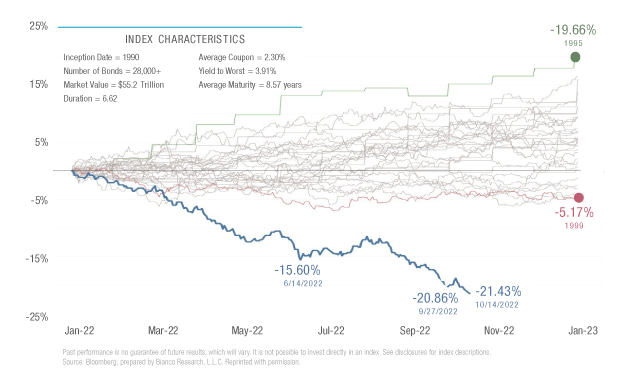
Past performance is no guarantee of future results, which will vary. It is not possible to invest directly in an index. See disclosures for index descriptions. Source: Bloomberg; prepared by Bianco Research, L.L.C. Reprinted with permission.
2. Bank on the banks
The U.S. banking system has significantly bolstered its financial wherewithal since the Global Financial Crisis (“GFC”). Over a trillion dollars of capital has collectively been added to the banking system’s equity base since 2009, while accounting changes that took effect in 2020 have pushed banks to hold loan loss reserves to cover the expected lifetime losses rather than just one year (see Figure 2). In a period of higher interest rates, banks are also expected to benefit as loans reprice faster than deposit costs. Furthermore, the credit rating agencies have recognized the resiliency of the U.S. banking sector with recent upgrades of banking giants JPMorgan on September 29, 2022 and Morgan Stanley on May 17, 2022. We see the sector’s relative underperformance in 2022 being largely due to technical factors rather than fundamental forces, including heavy supply of new senior debt which has weighed on returns. For example, year-to-date new supply of financial issuance, representing 51% of the total investment grade corporate supply, is at its highest level in 15 years. In dollar terms, financial supply totaled $562bn through early November.1 Looking out to 2023, a backdrop of stable earnings, reduced supply, solid capital ratios, improved credit ratings and attractive valuations have raised our expectation for the banking sector to outperform the industrial component of the market.
Figure 2: Tier 1 leverage capital to total assets
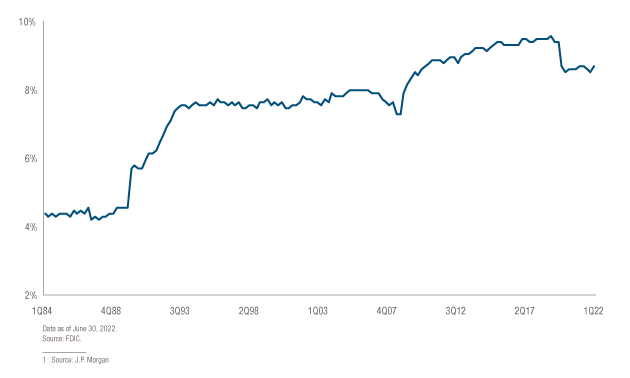
Date as of June 30, 2022.
Source: FDIC.
3. Peak volatility is behind us
Periods of elevated bond market volatility (see Figure 3) typically create pockets of dislocation across certain segments of the market. Two sectors that benefit from the recent rate volatility include low dollar priced investment grade credit and agency mortgage-backed securities.
Figure 3: Bond market volatility
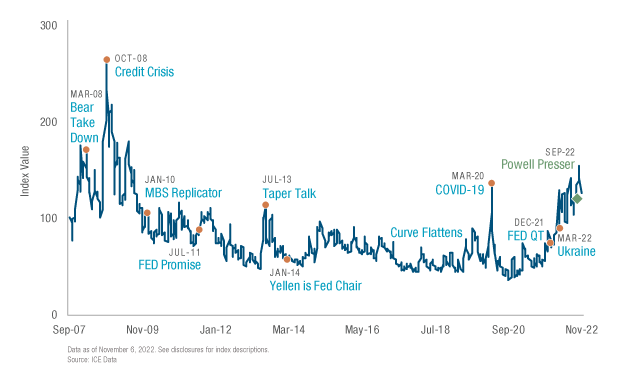
Date as of November 6, 2022. See disclosures for index descriptions.
Source: ICE Data.
More specifically, investors can sell high coupon investment grade corporate bonds in favor of discounted low coupon bonds at similar spreads and yields. This can help to preserve income while managing downside risk. Mortgage-backed securities will benefit from a fall in volatility, which we believe will happen as the Fed steps down the size of its rate hikes. Mortgages are currently trading at a spread to U.S. Treasuries well above the 20-year median of 125 basis points with what we see as low prepayment risk. Mortgages suffered in 2022 due to multiple factors: 1) elevated rate volatility, 2) the disappearance of two large buyers, banks and the Federal Reserve, and 3) aggressive tightening of monetary policy that created an inversion of the U.S. Treasury yield curve. As interest rates have reset to higher levels, we are more likely to see a meaningful decline in mortgage refinancings, slower new home sales and overall reduced housing turnover that will ease supply of mortgages.
4. Disinflationary progress
We believe the green shoots of disinflation that have appeared in the fourth quarter of 2022 will continue well into 2023. As seen in Figure 4, the signs of disinflation are emerging across many segments of the U.S. economy from rents and automobile prices to trucking freight rates and market measures of inflation expectations. Monetary policy operates with a very long lag and this time is no different. As a result of the Fed’s aggressive rate moves and tightening of financial conditions, aggregate demand is already in decline. This can be evidenced by recent global Purchasing Manufacturing Index (PMI) surveys, higher unemployment along with moderating real income and reduced consumer savings. These disinflationary trends should continue to root themselves into 2023.
Figure 4: Signs of disinflation emerging
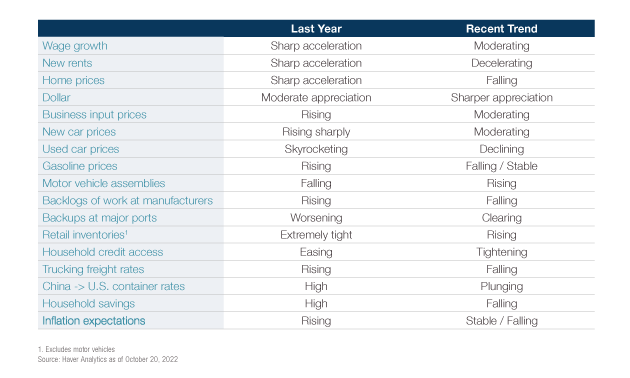
1. Excludes motor vehicles
Source: Haver Analytics as of October 20, 2022
5. Quantitative tightening remains the unknown risk
As the Federal Reserve seeks to reduce the size of its balance sheet in a process known as quantitative tightening (“QT”), a lack of liquidity will continue to weigh on the market’s ability to function normally. The Fed’s balance sheet currently stands at approximately $8.6 trillion as of November 16, 2022. The Federal Reserve has stopped reinvesting the assets on its balance sheet up to a maximum of $95 billion per month, with expectations to reduce it by approximately $1 trillion in 2023. Additionally, Wall Street dealers have reduced holdings on their own balance sheets, adversely impacting liquidity in both the U.S. Treasury and credit markets. As seen in Figure 5, the Treasury market’s liquidity, measured by the average yield error across the universe of U.S. Treasury notes and bonds with remaining maturities of at least 1-year, is at its worst levels since the depths of the COVID-19 pandemic in 2020. Poor liquidity in the Treasury market also spilled over into the credit markets, particularly in U.S. investment grade corporate and high yield bonds, as measured by the Federal Reserve’s Corporate Bond Market Stress Indices.
Figure 5: Treasury market liquidity
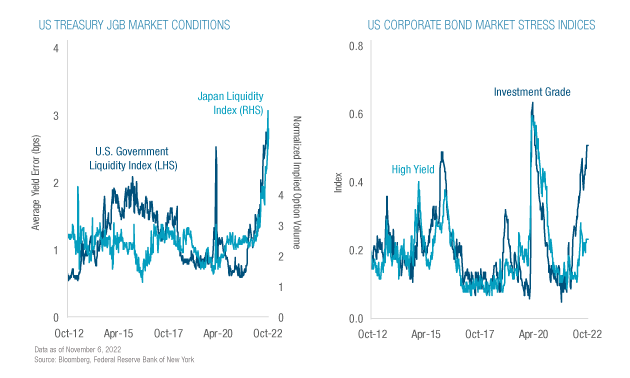
Data as of November 6, 2022.
Source: Bloomberg, Federal Reserve Bank of New York
Related: US Jobs Data Gives Fed License To Keep Tightening, Wall St Sell Off Resumes