
We have been vocal that long-term Treasury bonds are an excellent investment at current yield levels. However, timing the purchase of bonds will prove difficult as numerous headwinds may temporarily impede their path lower in yield.
Discussing the potential headwinds to our trade idea is an important disclosure, given how often we voice our bullish bond opinion.
First, though, we remind you once again why we like bonds.
Key Takeaways
- Economic and inflation trends will likely continue their pre-pandemic trends.
- Bond yields and inflation are closely correlated.
- As the Treasury’s x-date nears, more bond investors may sell.
- Post-debt cap resolution will be met with significant Treasury debt issuance.
- The Fed is not doing the Treasury any favors.
Our Bullish Case for Bonds
Economic and inflation trends of the last 30 years will continue. That is it! That is our simple and concise thesis for why bond yields will be markedly lower in the future.
Pandemic-related fiscal and monetary stimulus generated above-trend economic growth and high inflation. Consequently, bond yields spiked to levels last seen 15 years ago, as shown below. They also broke the downward trend persisting for thirty-plus years.
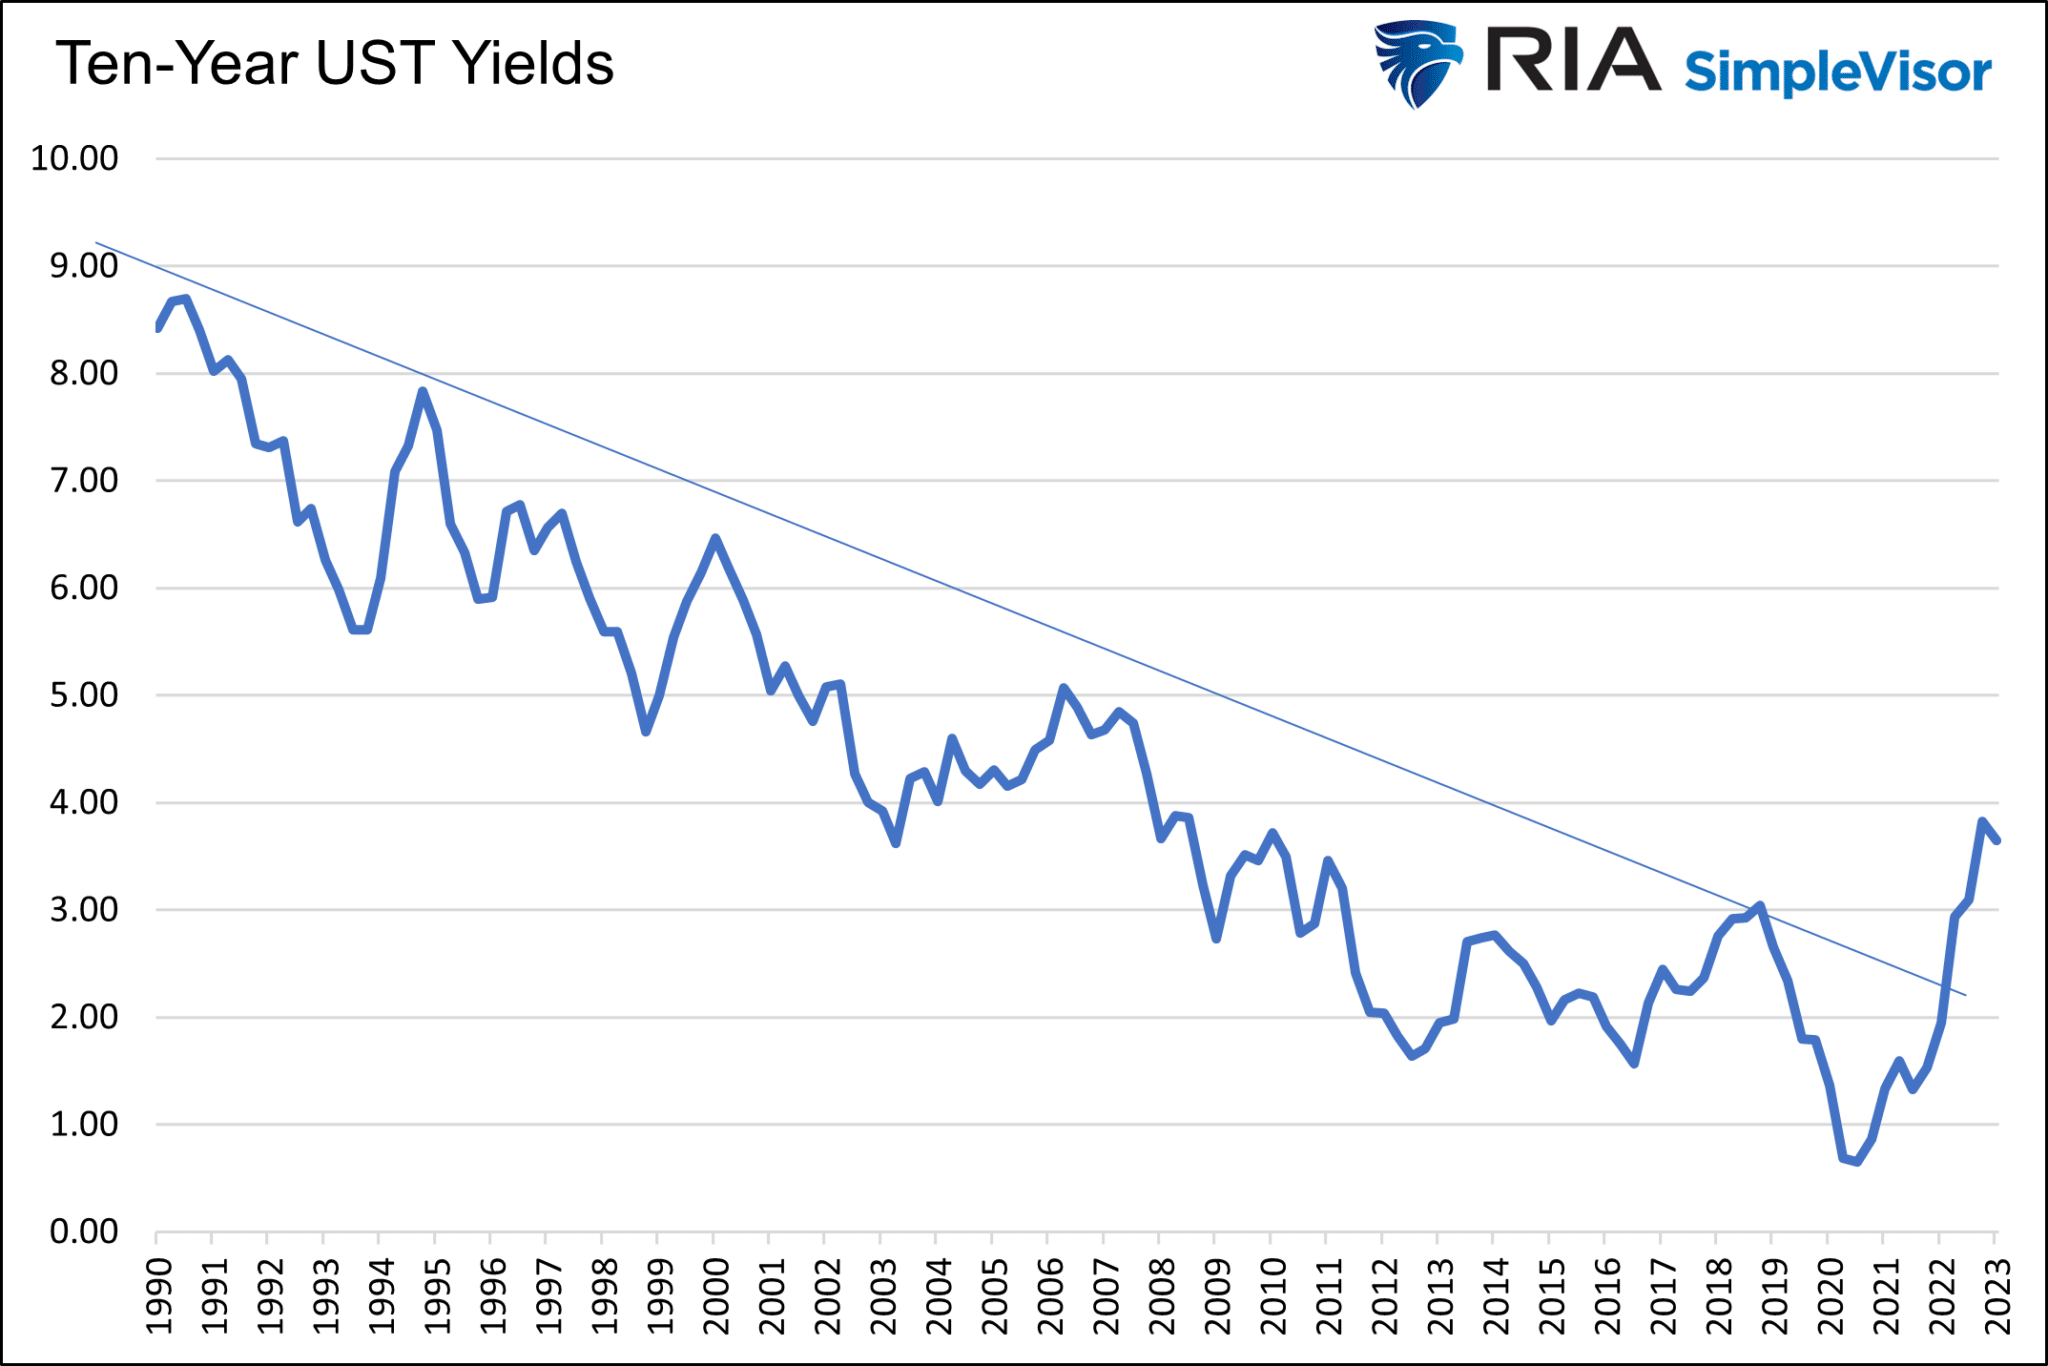
Our thesis rests on the premise that the current yields, reflecting the past few years’ events, are an anomaly, not a new trend.
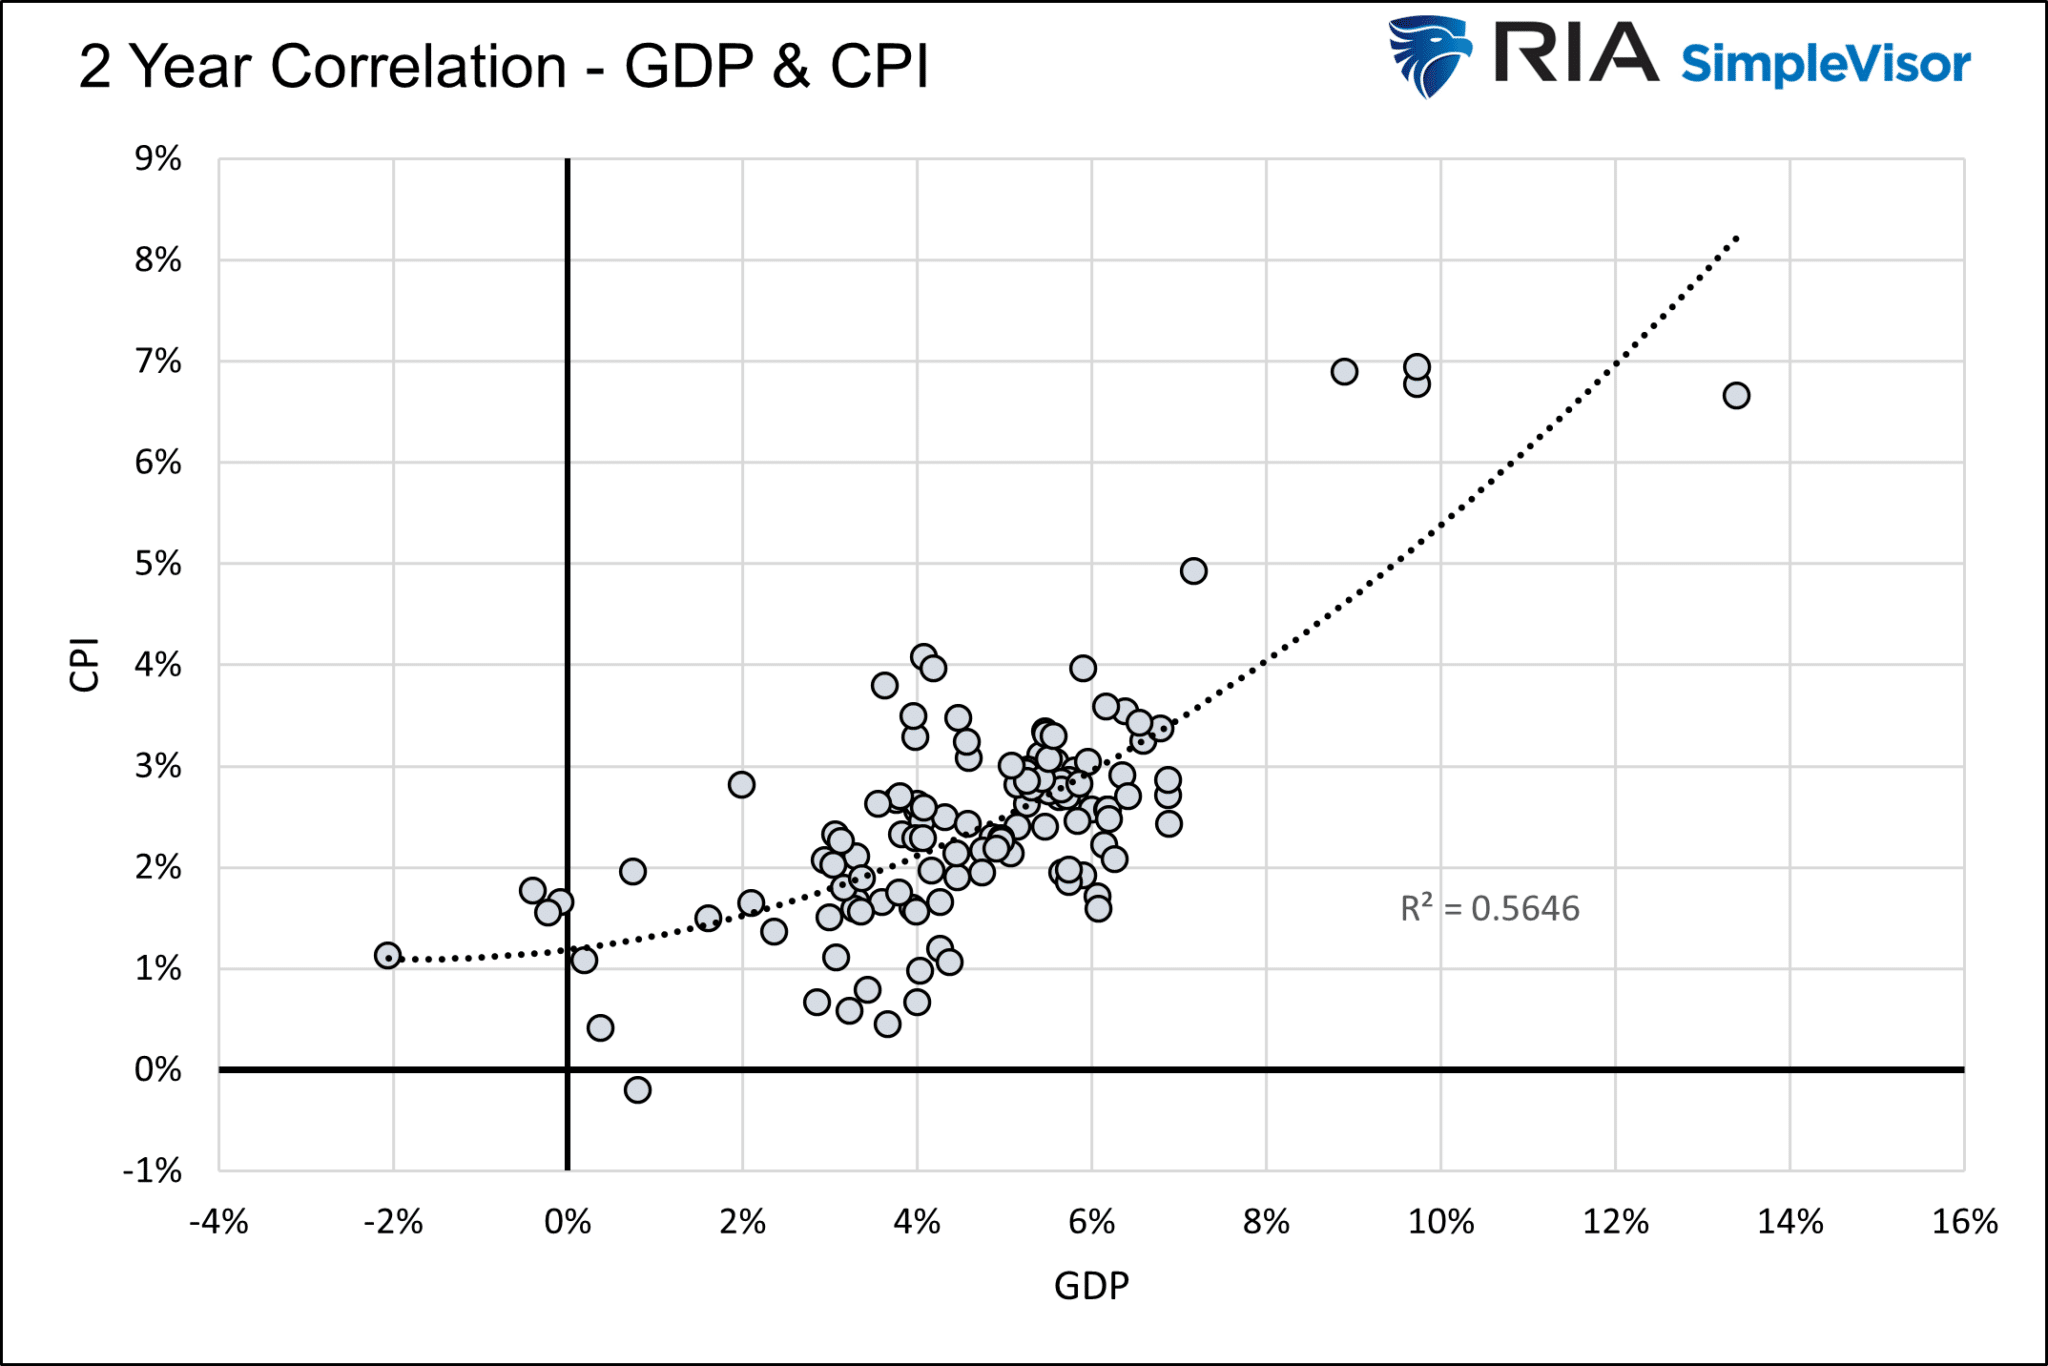
Bondholders invest to increase their future purchasing power. They can only achieve such a goal by earning a yield greater than inflation. Therefore, bond yields are a function of expected inflation, primarily a function of economic activity.
As economic activity gravitates downward toward its natural rate of 1.5% to 2.0%, inflation and bond yields will surely follow.
The graph below shows the strong correlation between economic growth and inflation.
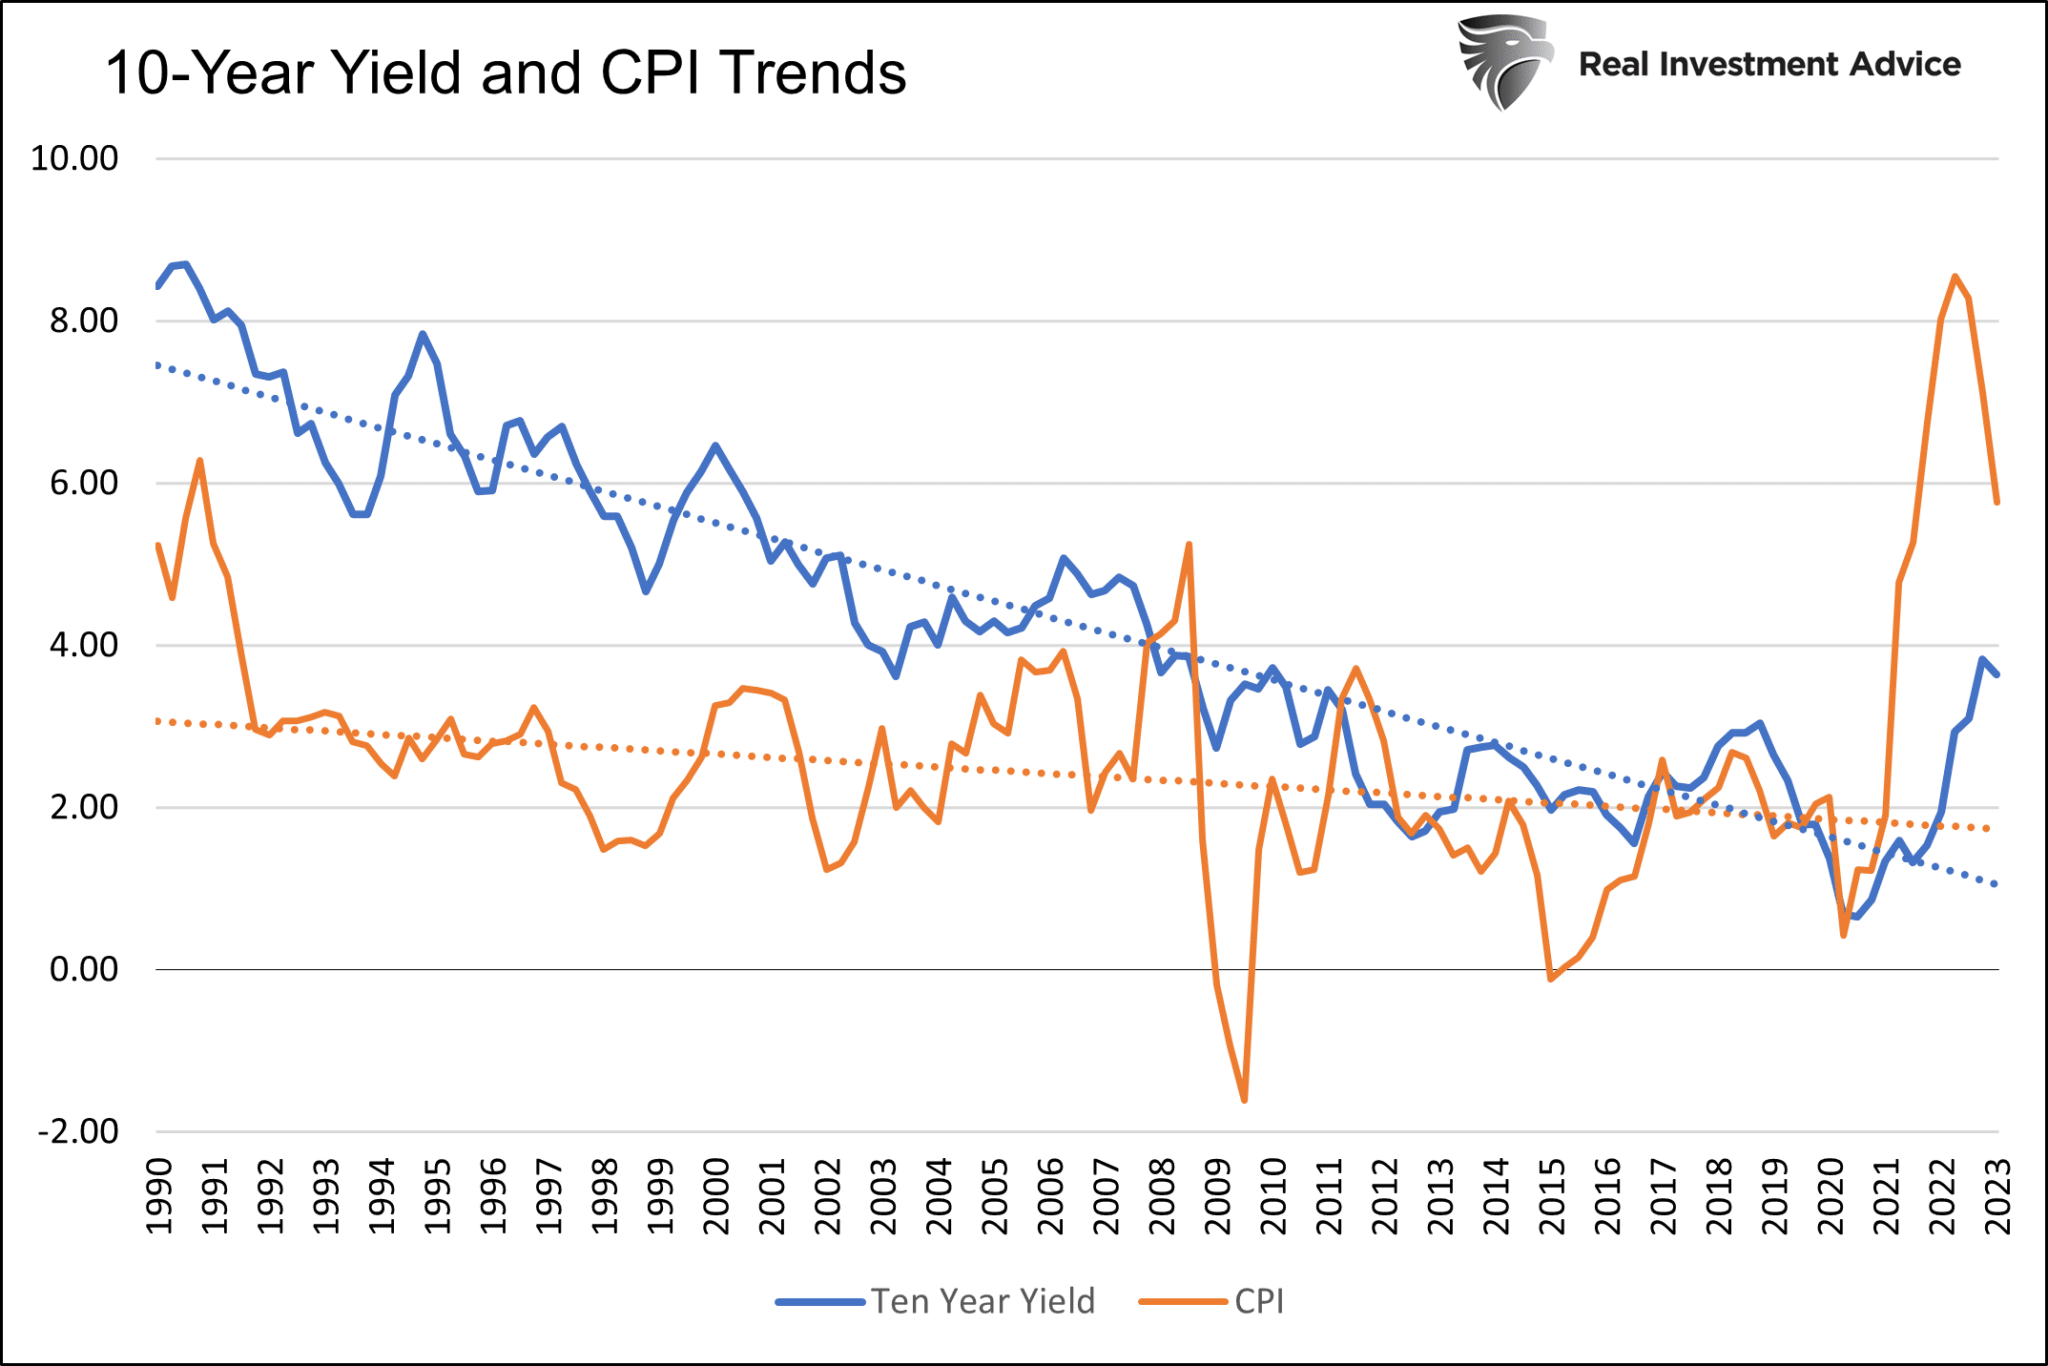
The following graph shows that bond yields and inflation have trended lower for the last thirty years.
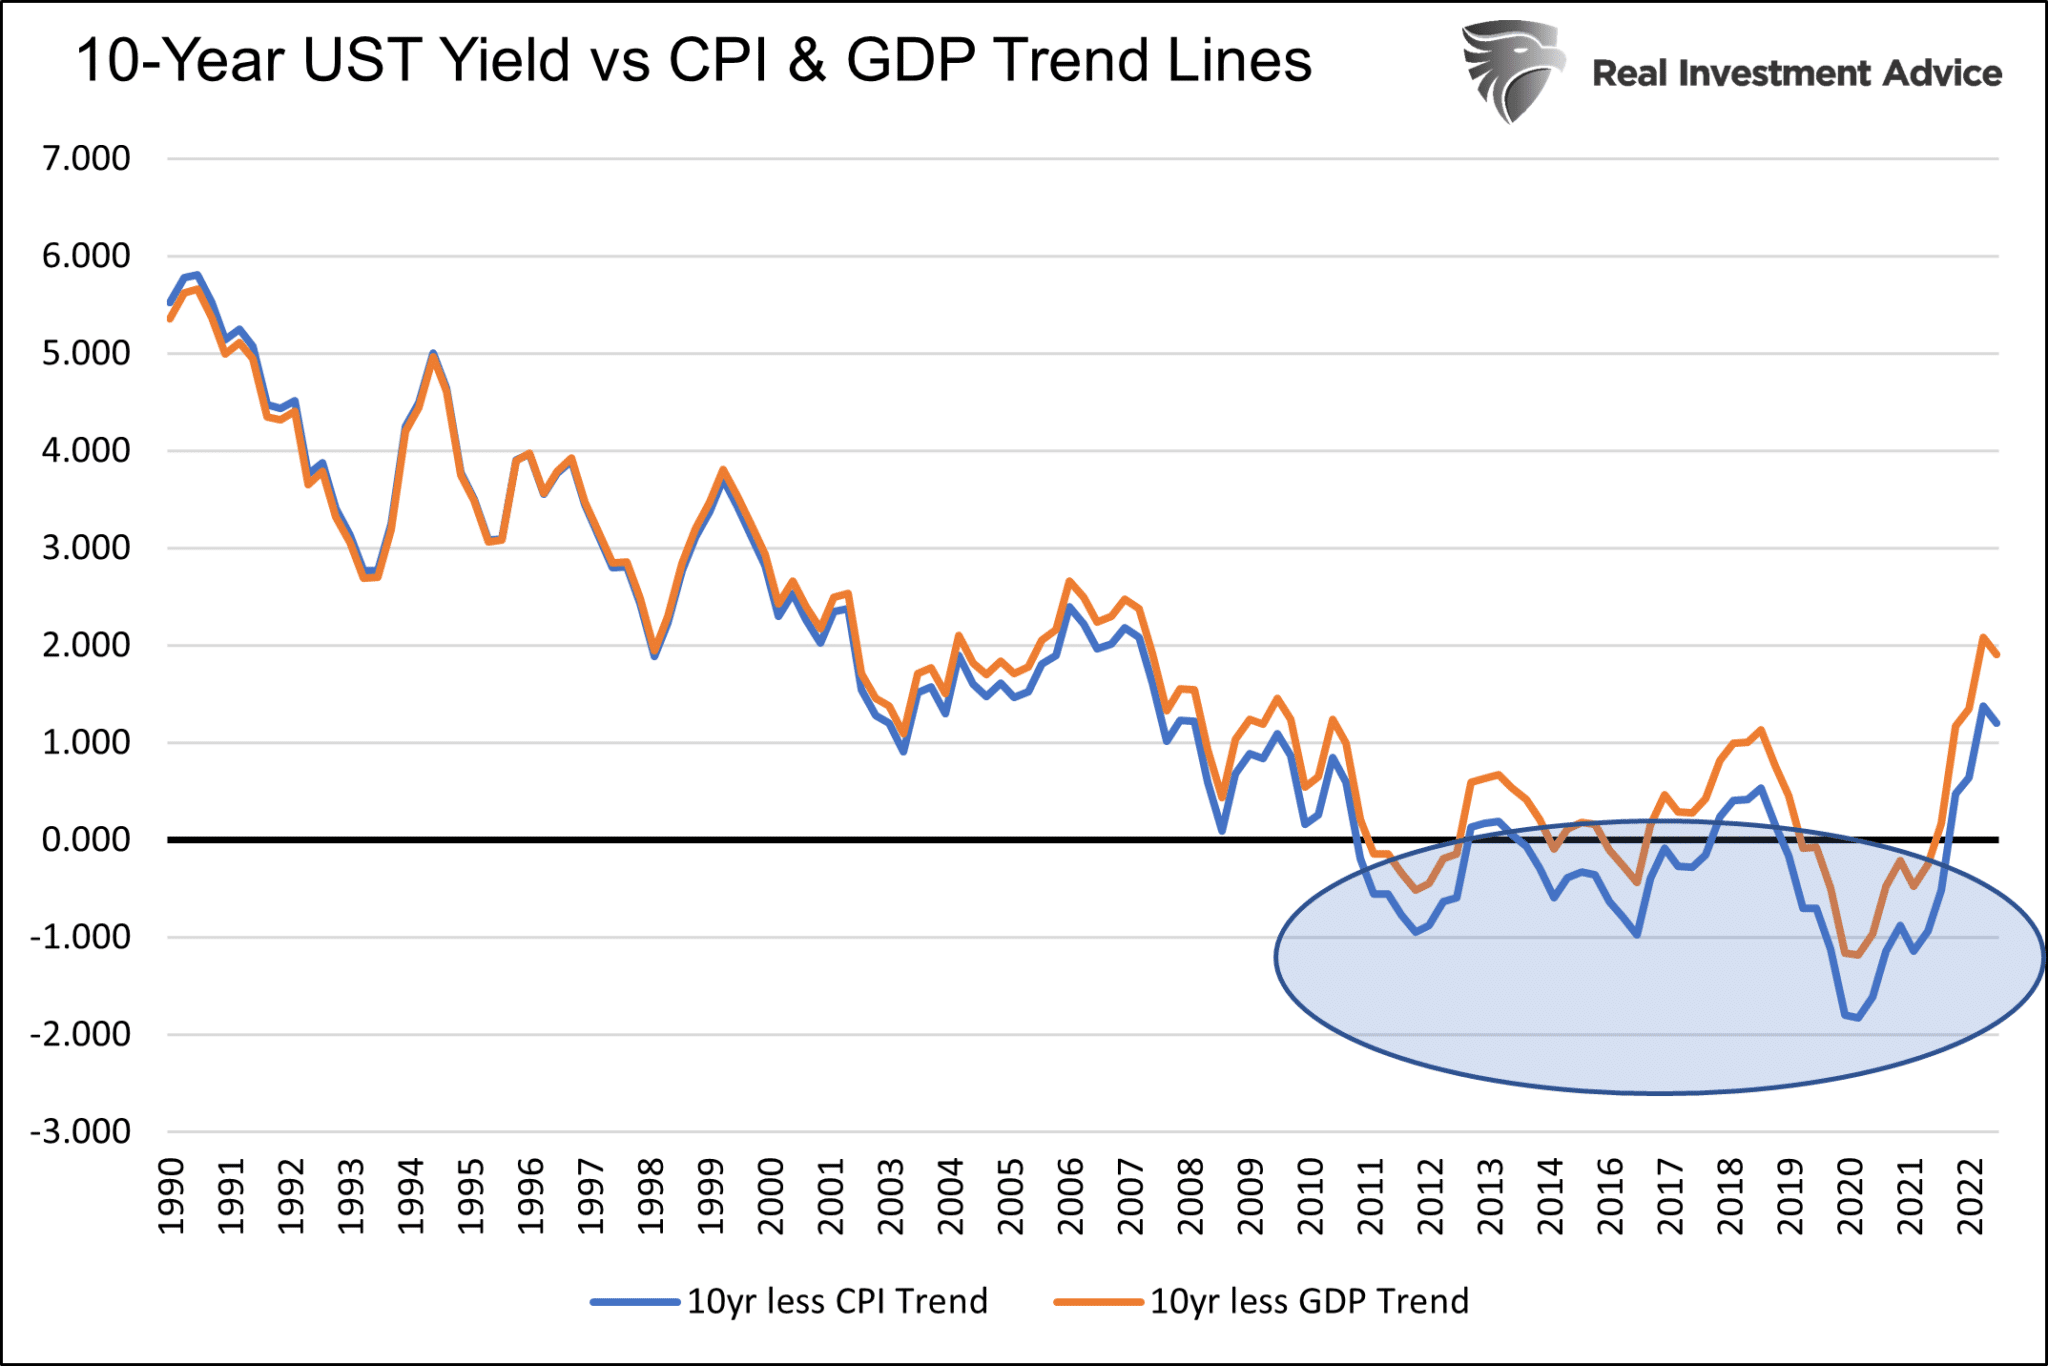
The current Ten-year U.S. Treasury yield, less the CPI and GDP trend lines, is significantly elevated from the prior trend, as shown below. If pre-pandemic inflation levels resume, the ability to earn a long-term yield of 1.50-2.00% greater than the likely ten-year future inflation rate will be a steal. The circle within the graph shows that achieving a positive real yield (yield less inflation), even if small, has been an anomaly, not the rule over the last fifteen years.
Headwind 1- Debt Cap Drama
As political tensions heat up and the date of potential default (x-date) nears, the media and politicians will amp up their scare tactics. To wit:
- The debt ceiling must be raised to avoid economic calamity- Janet Yellen
- The fight over the debt ceiling could sink the economy – NPR
- US debt ceiling impasse pushes government credit default swaps to record high – Reuters
- How a U.S. default crisis could devastate your finances – Forbes
Such harrowing statements cause consternation among bondholders. Some domestic investors may sell bonds and move to cash until the situation is resolved. Foreign bondholders, less familiar with the ritual debt cap shenanigans, may also seek shelter. While most of the volatility will occur in the shortest of maturities, longer bonds will also gyrate with the headlines.
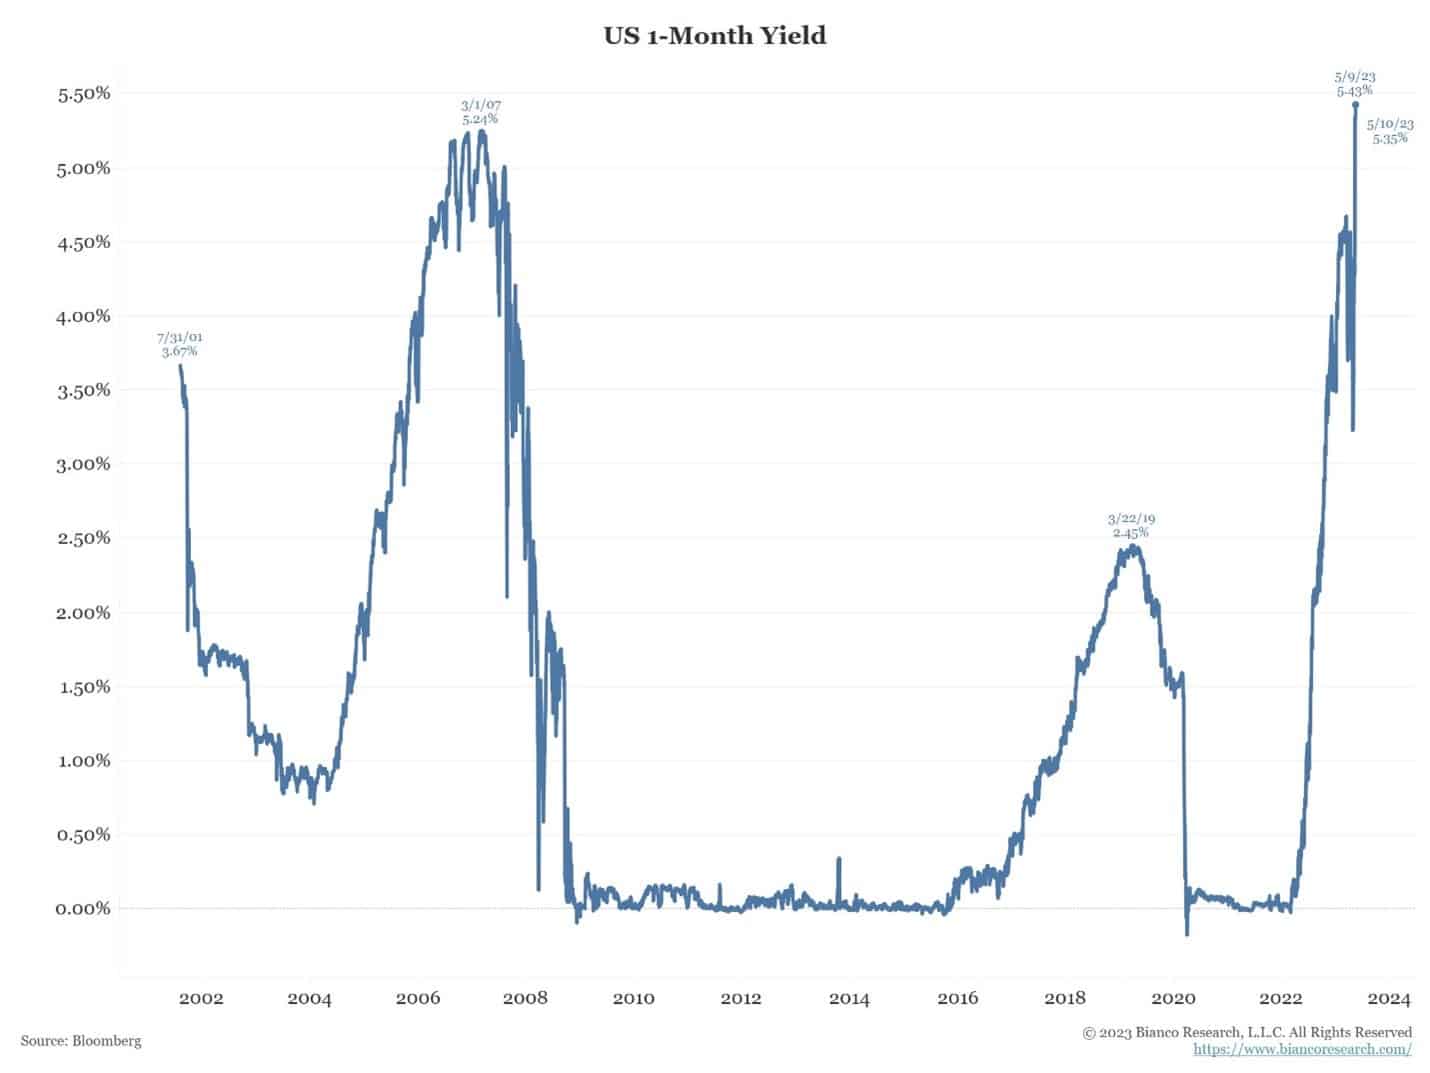
The graph below, courtesy of Bianco Research, shows the tremendous volatility in one-month bond yields. Short-term investors flocked to one-month Treasury bills when the x-date was longer than a month. At the time, the one-month yield fell to as low as 3.25%, while similar two- and three-month bills were around 4.75%.
With the x-date now occurring before the one-month bill matures, the yield is 5.60%, .50% above the 5.10% it should reside at.
Headwind 2- Post Debt Cap Issuance
Per Yahoo Finance:
For the first seven months of the fiscal year, the budget deficit hit $924.5 billion, more than double the same period of 2022, according to budget figures released Wednesday by the Treasury Department. Weaker revenues — including diminished transfers from the Federal Reserve — and bigger outlays for interest on the public debt, education and Social Security are among factors that propelled the widening.
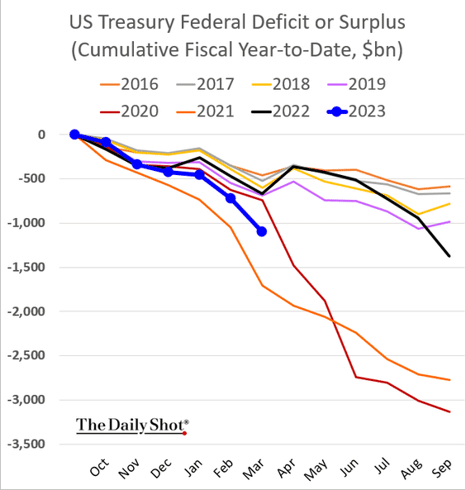
The graph and comments highlight the sizeable fiscal deficit. As the chart shows, the deficit for fiscal 2023, thus far, is running on par with 2020 and 2021. Both years saw massive covid-related stimuli. The nation is running an emergency-like deficit despite a strong economy and the end of the pandemic.
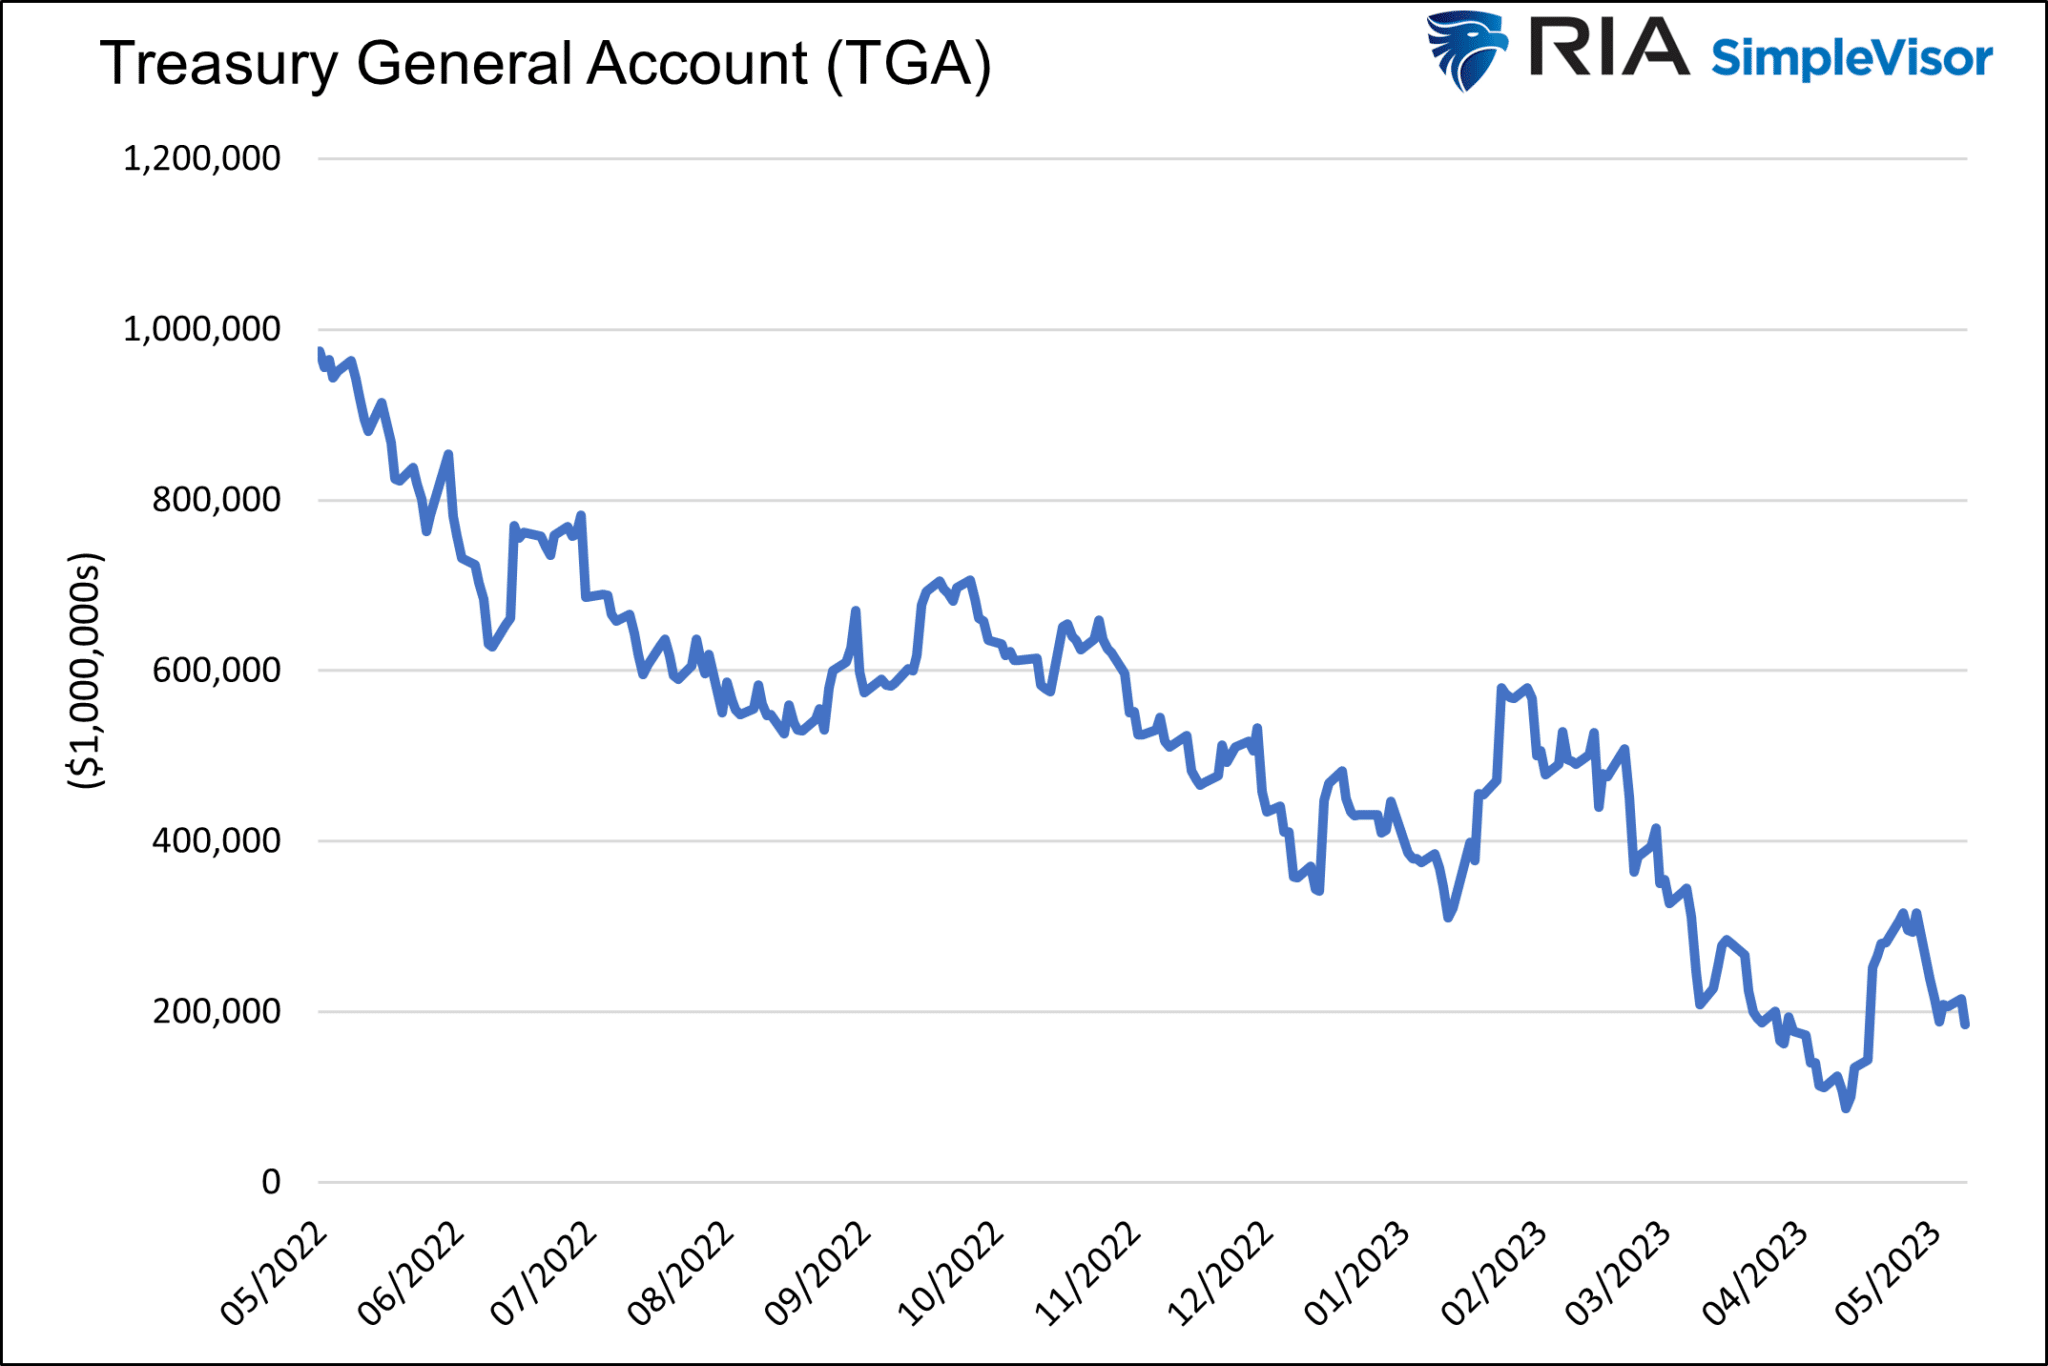
Since January, when the Treasury debt outstanding hit $31.4 trillion, the Treasury ceased adding additional debt. Instead, they have used their “checking account” held at the Fed to fund the nation. The formal name for the account is the Treasury General Account (TGA). The graph below shows the steady decline in the TGA. It is expected to hit zero by June 8, 2023.
Once Washington agrees to increase the debt cap, the Treasury will ramp up issuance to restock its “checking account” and fund the widening deficit. Such a bump in the supply of bonds may require higher yields to help the bonds find a home. That said, the market knows heavy supply is coming and is likely pricing in much of the issuance before the Treasury issues new debt. Given the seemingly insatiable demand for Treasury Bills, the issuance bump may affect longer-term debt more than shorter-term debt.
Headwind 3 – Higher for Longer, QT, and Fed Remittances
The Fed, via monetary policy, drives up the deficit through higher interest expenses and remits less money to the Treasury. Further, the Fed is reducing its holdings of bonds.
The graph below shows that the Treasury’s interest expense has risen over $300 billion or 50% in a little more than a year. It now rivals defense spending. Higher inflation and the Fed’s monetary policy are to blame.

The Fed typically remits its interest on its bond holdings to the Treasury. Per the Fed:
The Federal Reserve Act requires the Reserve Banks to remit excess earnings to the U.S. Treasury after providing for operating costs, payments of dividends, and any amount necessary to maintain a surplus.
In 2021 and 2022, the Fed sent $109 and $76 billion to the Treasury, respectively, which ultimately reduced the Treasury’s borrowing needs. This year, the Treasury should expect very little help from the Fed.
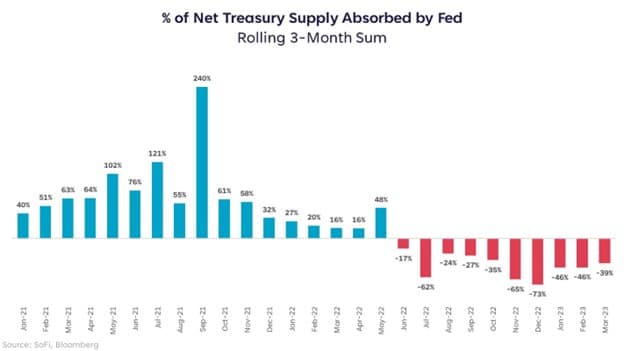
Lastly, the Fed is reducing its balance sheet via quantitative tightening (QT). Doing so will essentially put an additional $95 billion of Treasury and mortgage bonds into the market every month. The extra supply will sap demand for new issue U.S. Treasury bonds.
The graph below shows how much new issuance the Fed absorbed via QE and is now returning those bonds to the market via QT.
Summary
The headwinds to lower bond yields are significant but surmountable as demand for bonds is high, especially at today’s yields. Further, if one believes the economic and inflation trends of the past thirty-plus years return, current yields are well above their potential lows. Only three years ago, the ten-year Treasury yield was 0.50%!
It’s important to note that just because one invests in a long-term bond does not mean they hold it until maturity. We envision holding long-term bonds until yields revert to pre-pandemic levels. At that point, we may sell the bonds, monetize the yield change, and reinvest the funds into another asset class or even higher-yielding corporate bonds.