
Trending

Numerous bond narratives are driving long-term bond yields higher. “Crippling deficits” and a tariff-induced inflation sit at the top the list. We have repeatedly poked holes in these narratives. Instead of dwelling further on them, let’s consider what tomorrow’s narratives might be. When the bond market changes direction and yields fall, the two narratives we share below, and others, may replace today’s bearish narratives.
Cautious investors scramble to lock in higher yields.
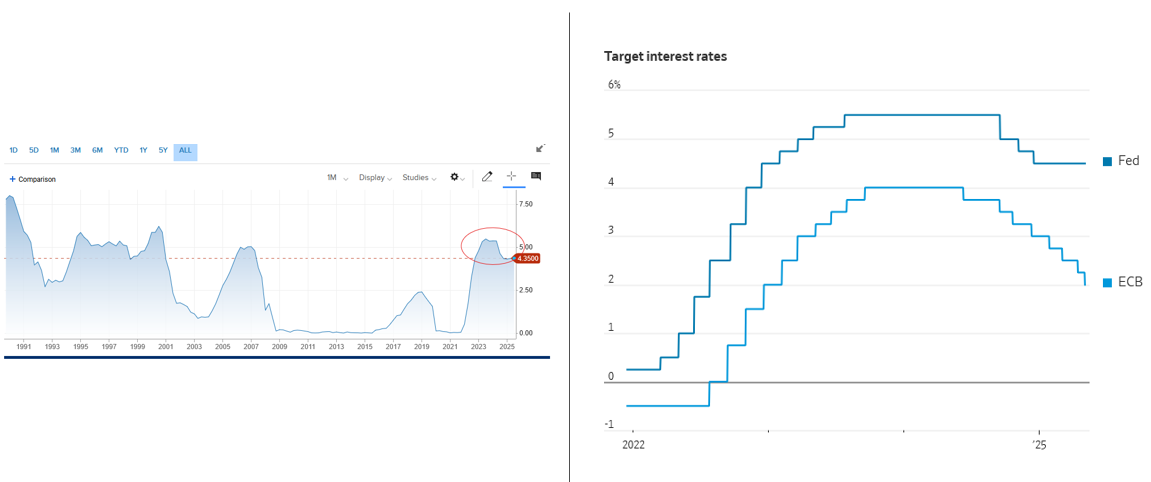
Money market yields have been 4% or higher for almost three years. That compares to near-zero rates for the ten years prior. Having spoken with several clients, we get the impression that some conservative investors believe higher money market yields are a permanent feature of the financial markets. Consequently, they have become complacent about locking in higher rates for extended periods. Once the Fed begins cutting rates and money market yields fall below 4% and then 3%, these investors will start gravitating toward longer-term bonds. The flight to exit cash could be a powerful driving force pushing yields across the maturity spectrum lower. The graph on the left shows that 3-month Treasury bill yields are abnormally high compared to the ten-plus years preceding the Fed’s fight against inflation.
Foreign investors want more yield.
On a similar note, the graph on the right shows the ECB has been more aggressive about cutting rates than the Fed. As a result, the interest rate differential between the Fed and the ECB is now 2.5%. Foreign investors are being increasingly incentivized to buy US bonds and sell European bonds. Furthermore, the dollar has declined by over 10% this year. Consequently, if these investors believe that the dollar will reverse course as tariffs get sorted out, the potential return pickup, including dollar gains, could be much greater than 2.5%.
Market Trading Update
Last week, we discussed the successful test of the 200-DMA.
“Most notably, this past week was the successful test of the 200-DMA. The pullback to that previous broken resistance level and subsequent bounce highly suggests that the April correction is complete and that market control returns to the Bulls. As such, there is very little resistance between current levels and all-time highs. However, as noted last week, with the markets still overbought on a momentum basis, further consolidation will be unsurprising before an advance to new highs occurs. With the MACD sell signal triggered and money flows declining, another test of the 200-DMA next week would be unsurprising.”
Despite a weakening unemployment report, a spat between President Trump and Elon Musk, a resurgence in the Ukraine/Russia conflict, and remaining tariff uncertainty between China, Europe, and the U.S., the markets continued their bullish ways this past week. Notably, the market broke out of the ongoing consolidation process that has been in place since May 12th. The good news is that bullish breakouts confirm bullish momentum and suggest markets will trade higher into the next resistance level. That next resistance level is at 6100, the previous topping process before the March and April decline.

The market remains overbought short-term, but it is not uncommon for markets to stay overbought longer than most expect. While we patiently await a pullback to increase portfolio exposure, that could be a while longer before it occurs.
Critically, we are not looking for LOWER prices to add exposure. I am okay with paying higher prices. However, we are searching for the best risk/reward opportunity to add exposure. As such, a consolidation period that allows relative strength or momentum to cool off somewhat will provide a better buying opportunity than under current conditions. We already have sufficient exposure to the market to gain performance when markets rise, but deploying capital at these levels is more “risky” than I prefer.
While the probabilities are increasing that the market will potentially rally from here to 6100, there is an equal risk of disappointment. In other words, the risk/reward equals one, which is not a compelling “bet” for deploying capital. However, with some patience and the willingness to sacrifice some short-term performance, we will get an opportunity where the risk/reward proposition improves markedly. Those opportunities happen with regularity, just not when most expect them.
Let’s explore the seasonal stock market performance in June and the summer, and where the best opportunities may be found.
The Week Ahead and BLS Employment Report
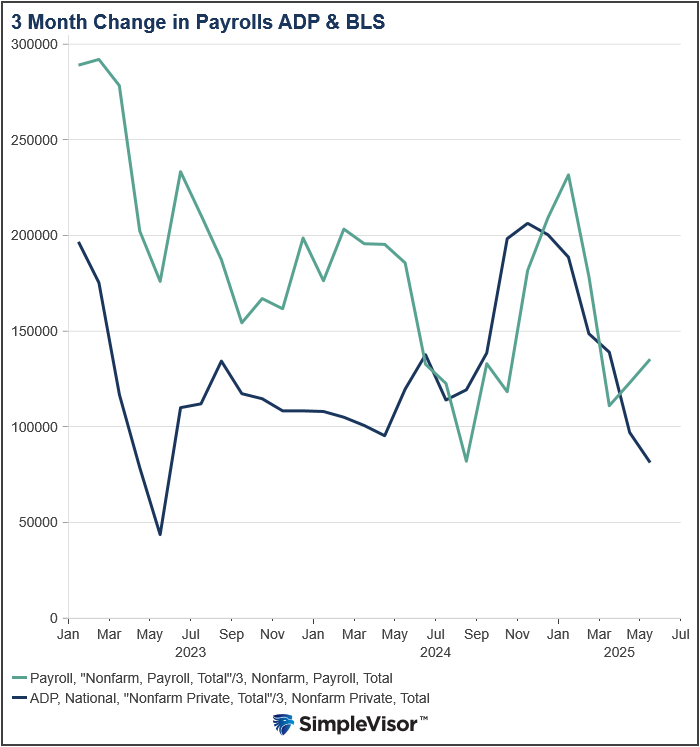
The ADP jobs data on Wednesday came in well below expectations with a gain of only 37k. The BLS payroll gain was healthy at 139k, but the BLS revised the prior two months lower by a net 95k jobs. As we saw again on Friday, the initial prints of the ADP and BLS data have been moderately different. However, the revised data, as we share below, are a little more aligned. Of concern, in addition to the revisions, is the household survey, which reported a loss of 696k jobs. Year to date, the household survey is down 622k jobs, while the establishment survey is 508k jobs higher. Had the participation rate not declined by .2% this month, the unemployment rate would have risen.
A significant amount of pertinent inflation data is being released this week for the FOMC to consider before its meeting next week. The CPI is expected to increase by 0.3% on Wednesday, 0.1% higher than last month. PPI is expected to rebound from -0.5% to +0.1% on Thursday. Thursday’s initial jobless claims and continuing jobless claims data will be under more scrutiny as they have been increasing gently.
The Fed will enter its pre-FOMC meeting media blackout this week. On Wednesday and Thursday, the Treasury will auction 10 and 30-year bonds, respectively.
Does Consumer Spending Drive Earnings Growth?
It would seem evident that most investors would understand that consumer spending drives economic growth, ultimately creating corporate earnings growth. Yet, despite this somewhat tautological statement, Wall Street appears to ignore this simple reality when forecasting forward earnings. As discussed recently, S&P Global’s current estimates show earnings are growing far above the long-term exponential growth trend from 1936. Unfortunately, with regularity, earnings tend to repeatedly revert to the long-term trend due to economic recessions, financial crises, or other events that crimp economic activity. In the chart below, earnings haven’t stayed at the top of the long-term growth trend channel for long. The current exponential growth trend for earnings is $195/share.

The obvious question is, what would cause earnings to revert so drastically from current levels?
Tweet of the Day

“Want to achieve better long-term success in managing your portfolio? Here are our 15-trading rules for managing market risks.”
Related: Why the U.S. Deficit Crisis Is Actually a Recession in Disguise