
Trending

Written By: Pavel Medvedev, Digital Growth Strategist at TakeProfit.com
TradingView Grid Layout vs. Multi-Chart Systems: Overcoming Infrastructure Bottlenecks to Plot Multiple Indicators on One Chart
The convergence of algorithmic execution and self-directed retail market participation has fundamentally altered trading decisions and infrastructure requirements. In the current market environment, a single trader must frequently evaluate real-time data across high-volatility asset classes, ranging from a volatile cryptocurrency symbol to traditional stock and forex markets. Capturing short-lived trading opportunities requires a comprehensive view of overall market conditions. However, while institutional matching engines process millions of requests per second, the frontend web application layers used to execute technical analysis have increasingly become a severe performance bottleneck.
Historically, web terminals have relied on standard browser rendering to display a financial instrument. Yet, when market participants try to build an advanced trading system that spans multiple timeframes and requires they use multiple indicators simultaneously, the physical constraints of a legacy chart window become a structural liability. The industry is responding with a massive shift from CPU-bound architectures to hardware-accelerated, customizable systems designed for multi-chart rendering.
The Technical Limits of a Free Multi-Chart Template
TradingView remains the benchmark for web-native market visualization, driven by a massive ecosystem of over 100 million users and extensive global data integration. However its core interface mechanics and commercial tiers dictate exact constraints on how a participant can configure their primary chart workspace.
Legacy terminals are traditionally built on top of the browser’s Document Object Model(DOM) using HTML5 and JavaScript canvas structures. When an investor opens multiple charts or attempts to track erratic price movement across several tabs, DOM-based rendering struggles with escalating memory consumption and CPU thread throttling. To prevent memory degradation during an active trading session, platforms must artificially restrict user workspaces through a rigid grid layout.
Under this model, a free user is restricted to just one chart per tab to conserve local computing resources. To scale up a workspace, monitor multiple asset classes, or save a multi-chart template, users are forced to upgrade through tiered paid subscriptions. Even on the highest tier, the platform imposes a hard cap of 16 charts per layout. This strict configuration limits data density and directly dictate how many historical bars use active browser memory during rapid market shifts.
Hardware Acceleration: Configuring a Widget System for High-Volatility Data
To track highly liquid instruments without data lag, a trading terminal's underlying rendering engine requires low-level optimization. To solve the multi-chart performance ceiling, emerging cloud platforms are moving away from standard, high-level web frameworks entirely
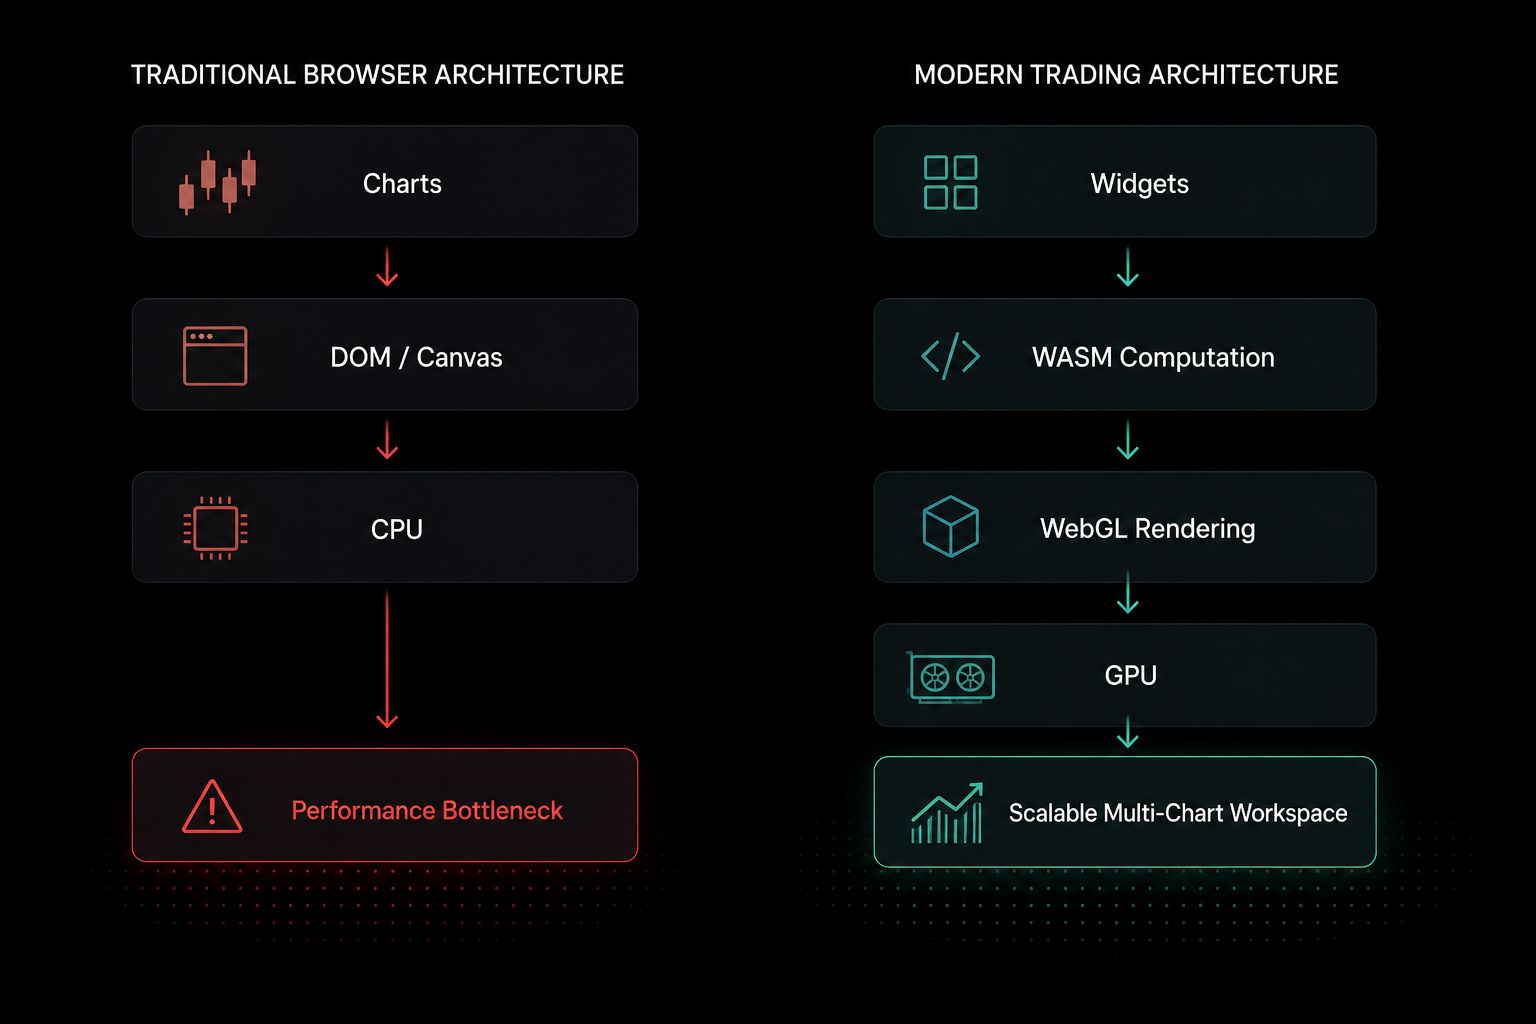
TakeProfit has approached this problem through systemic deep-tech engineering, utilizing a high-load microservice backend powered by Golang. Instead of building on top of a standard DOM layout, its responsive web application utilizes a WebGL and WebAssembly (WASM) stack. By leveraging C and C++ compiler optimizations, the platform offloads complex mathematical and graphical rendering directly to the user’s GPU hardware.
This architecture completely redefines how the browser processes high-density visualization components. Whether a trader is analyzing tick-by-tick order flow data or running custom script indicators, the terminal maintain fluid 60 FPS across highly complex chart resolutions. This eliminates the latency and freezing typically encountered when a current chart is flooded with incoming exchange liquidity updates.
Processing Complex Indicators Across Multiple Timeframes
When a platform offloads execution stress to the GPU, it can compute a highly demanding indicator template without sacrificing execution quality. In professional technical analysis, traders rarely look at a singl line; they cross-reference momentum and volatility across a primary chart and an adjacent mini chart to mitigate risk.
In a standard browser setup, plotting a different indicator on each layout screen easily leads to massive memory bloat. By contrast, a hardware-accelerated multi-chart canvas allows you to stack several indicators, such as a volume bar overlay, a moving average line, and a complex stochastic matrix—without bottlenecking the live workspace feed.
This setup makes sure that no matter how you like to trade, all your custom calculations is always visible when the market gives a clear signal to buy or sell. Remember, even though these advanced layouts help you read the chart really accurately, no tool can promise what will happen in the future or guarantee you'll make money based on what happened before.
Conclusion: The Modular Pivot
The world of cloud analytics is changing fast. People are no longer okay with outdated technology or limited payment plans. TradingView is still the best when it come to having a wide range of global assets and public scripts. However, its old grid system is a problem for users who need to handle a lot of data and use multiple screens at the same time. This old system creates barriers that make it hard for users to get what they need.
For people who need to track lots of things at once and want their computers to work really fast, a system that lets you customize how things displayed can make a big difference. When you can use the graphics card to handle visual tasks instead of the main computer chip, it's like a new era for programs that run in your web browser - they can finally work as well as the systems used by big trading companies. This means you can get the information you need quickly and easily,without having to deal with slow or clunky software.
Related: The Most Important Growth Decision Advisors Rarely Talk About