
Forget market forecasts. What counts is assessing the reward/risk balance. Here’s how I do it.
How’s the stock market going to do the rest of this year? Now, before you think about your answer, or if you even want to answer, forget I asked the question. Why? Because it’s a stupid question. Sorry I asked.
Here’s a better question: let’s assume the S&P 500 is sitting at exactly the 4,000 level. what are the chances it will go up 10% before it goes down? For instance, if you think there’s an 80% chance that it will reach 4,400 before it drops to 3,600, that’s a pretty positive tradeoff of reward to risk, right?
Your answer is not the critical part here. This is about setting the stage to discuss a key communication point between financial advisors and their clients. Furthermore, it is about converting that discussion from a no-win situation to an opportunity to add more value to your relationship with your clients.
It starts by recognizing the tremendous power within the following statement:
Every investment has the potential to increase in value at any time. The key is how much risk of major loss comes with that investment.
This is what I call the Reward/Risk Tradeoff. And as a longtime investment strategist and former client advisor, it is a springboard to some wonderful conversations with clients.
What is “major” loss? Ask five of your clients, and you might get five different answers. That is the point. We need to go beyond the casino gamesmanship aspect of how we portray investment risk and reward to clients. Instead, we need to think of it in a more tangible, simple way.
In the 35 years I have spent in the investment management field, I have been on an unending search for a concise way to assess that tradeoff between appreciation potential and the risk of major loss. Sure, we have standard deviation and a wide variety of ratios named after people who created them.
However, what investors really want is to know their odds of not having to go back to work, or otherwise alter their lifestyle. Frankly, those odds are always changing.
Your financial planning work can provide them with their odds. However, that assumes A LOT when it comes to how the financial markets will work going forward. It also assumes that the client can accurately forecast how they will react to the next March 2020, a 3-year stock bear market like 2000-2003, or a sustained rise in interest rates following a 40-year bull market for bonds.
That is why I created the Investment Climate Indicator (ICI). Over the past decade, I have published it in various forms in articles I have written for outlets such as RIABiz, Marketwatch, Forbes, TheStreet.com and most recently US News & World Report.
The ICI is not intended to be used in isolation. It is yet one helpful input to a holistic, contemporary investment process and portfolio design strategy.
At ETFPortfolios.com, a service created for financial advisors, we display the ICI, update it weekly, and add very brief, bottom-line talking points around it. This is all part of the free version of the site. Here’s a peek at part of it.
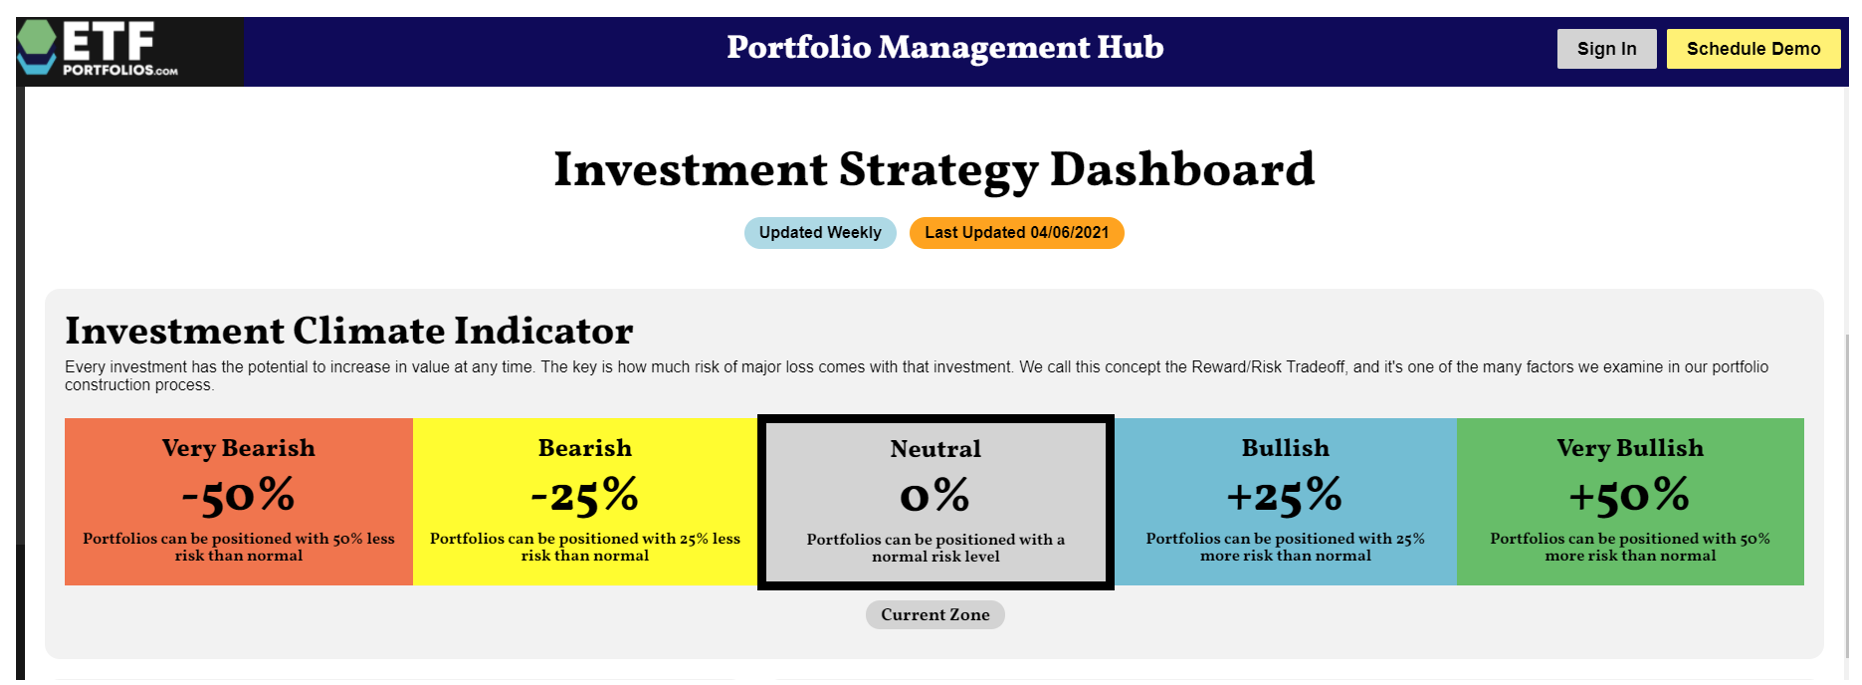
The Current ICI Says What?
As you can see, it is currently in the grey (Neutral) area, after flirting with the yellow (Bearish) area recently. Generally speaking, the ICI has been in a flat to down mode post Covid shock last year. As I read it, it is telling us that there is still opportunity for investors to see portfolio appreciation from traditional portfolio allocations. However, a mix of hedging and tactical management are getting more and more critical as 2021 progresses.
The ICI is neither an outright market timing tool. It is designed to be one of several inputs an advisor uses in their strategic and tactical portfolio allocation process. As such, it is designed to be applied differently to different types of clients. It is analogous to how you would use a level tool if you were hanging a picture in your office.
Risk Tolerance: modernized, re-defined, simplified
Think about it this way: if your client’s risk tolerance is a 6 out of 10, where 10 is most aggressive, traditional investment thinking tells you to rebalance back to a “6” risk level. This is usually based on the calendar, like quarterly or every six months.
The ICI is for advisors that think of risk-management a different way. Specifically, that a client may be a 6 over the long term. However, when risk of major loss is far greater than potential for sustained appreciation, no client who is a 6 wants to be a 6.
Alternatively, what if you were able to show them that you use the ICI or some other discipline to drift their level down to 5, 4 or even 3 at times, and tick it up to 7 or 8 when the odds are in their favor? From my experience using the ICI for a long time, there is a good chance you will see the light bulb of inspiration go off in their head, right in front of you.
The ICI’s primary role is to make the advisor and investor think. Specifically, to consider that markets go up and down based on a wide variety of factors, including economic, valuation, emotional and political factors.
I spent the past three decades crafting and refining the ICI, keeping it relevant with evolving markets. The detailed calculation that produces the weekly ICI is proprietary and trademarked, but the 6 main inputs we use are not. They are all well-known indicators. Short explanations of each follow below.
The 6 Components of the Sungarden Investment Climate Indicator (ICI)
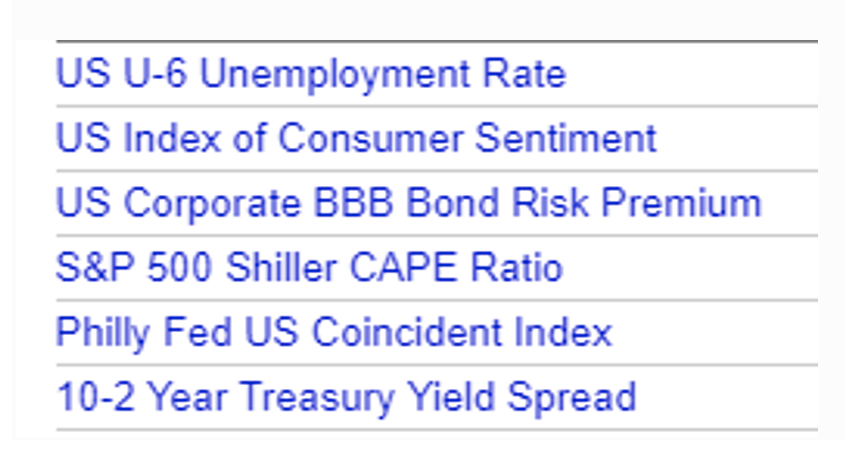
- The U-6 Unemployment Rate is more realistic assessment than the “headline” rate announced each month. It includes several varieties of under-employed and so-called “discouraged” workers.
- The Consumer Sentiment Indicator is included because consumers’ willingness to spend is the lifeblood of economic growth and corporate profits.
- BBB Corporate Bonds are on the edge of “junk” status, and their spread to Treasuries has been a good indicator over the years.
- The CAPE Ratio, Yale Professor Robert Schiller’s creation, provides a smoothed look at stock market valuation.
- Philly Fed’s Coincident Index is a collection of indicators that provide excellent input into current economic conditions. Examining how this shifts over time adds an important component to the ICI.
- Finally, the yield spread between 10-year US Treasury Bonds and 2-year Treasury Notes rounds out the list of indicators.
The power in the ICI is not in the individual components, but in how the move with or against each other over time. We track over 20 years of monthly ICI scores, and fit them into one of the 5 colored reward/risk ranges shown above.
Again, this is all about identifying and estimating the risk of significant loss, typically over the next 6-12 months. The type of loss that makes even patient, level-headed investors turn into panicky types when that inanimate object, the financial markets, turns against them. The ICI exists as a tool to help financial advisors to minimize the potential that in times of market chaos, their clients won’t turn against them.
You can wax poetic about where the 10-year bond is trading, what the Fed said, and what valuation and earnings forecasts look like. Clients may nod their heads when you talk to them about those things. But in my experience, that’s not what they care about. Not at all.
They just want to know if their portfolio is positioned for the worst, and that it can also participate in the best, in the coming months and years. And they want to have the confidence that you can quickly, simply provide evidence that within the scope of your advisory practice, that is something you do continuously.
That is what the ICI aims to be. If you would like to learn more about it, and examine a more detailed history of the Sungarden Investment Climate Indicator, email me at rob@sungardeninvestment.com
Related: