
Trending

Written by: Rafael Zorabedian
Are you getting frustrated waiting for a meaningful pullback in US equity ETFs? There have been pullbacks in some sectors if you know where to look.
If you like to buy on pullbacks in bull markets (like me), you may have trouble swallowing some of the price levels and medium-term overbought technicals on many instruments right now.
Digging deeper into the trenches, some areas have had meaningful pullbacks, and we are going to get into one ETF right now that is currently trading at/near key technical levels.
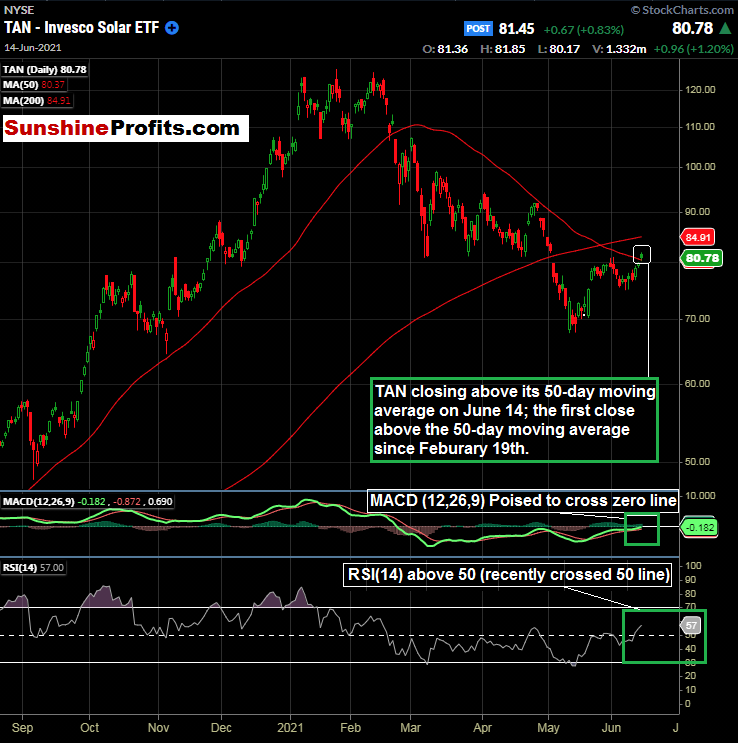
Figure 1 - Invesco Solar ETF (TAN) August 21, 2020 - June 14, 2021, Daily Candles Source stockcharts.com
I like to find bullish short to medium-term technicals, and the Invesco Solar ETF (TAN) just closed over its 50-day moving average yesterday. This technical action comes after a period of retracement and consolidation that dates back to the beginning of 2021. Its 52-week high close is $121.94, put in back on February 9, 2021.
The TAN ETF strategy and top holdings can be viewed here .
So, while everyone is still talking about inflation and the upcoming Fed decision, we can focus our attention on an ETF that has pulled back nicely over a four + month time period and is exhibiting some signs of bullish technical strength. Also, take note of the RSI above 50 (57) and the MACD poised to cross the zero line.
We can see that June 14th's candle was a gap higher and a close above the 50-day moving average. More clarity can be obtained by viewing an intraday 15-minute chart:
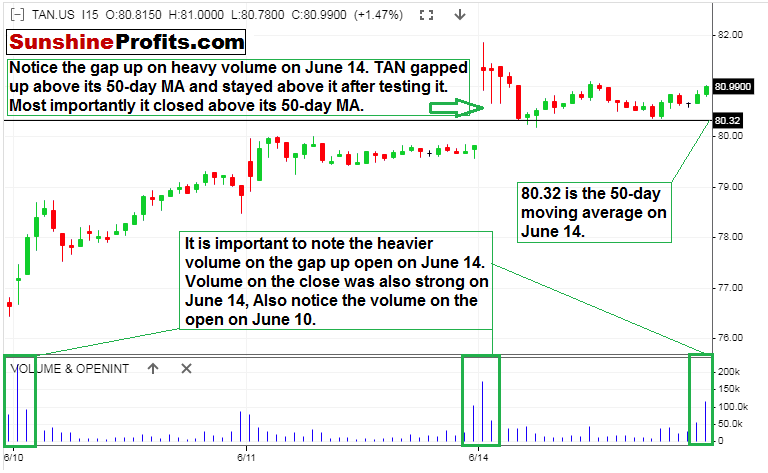
Figure 2 - Invesco Solar ETF (TAN) June 10, 2021 - June 14, 2021, 15 Minute Candles Source stooq.com
The gap-up volume and TAN ’s ability to stay above and close above its 50-day moving average could be a bullish signal.
US Administration and Solar Outlook
Just like some of the other markets that I am currently following, TAN seems to make sense given the current US administration and democratic congressional majority. In fact, just as I am writing this, Reuters published an article about first-quarter US solar installations soaring . I do wish that this article would come out later instead, but it is out now.
Although there are some supply chain concerns in solar right now (think commodities), there ought to be many initiatives and subsidies put forth by the Biden administration in the coming years. Regardless of your personal opinion on solar vs. fossil fuels, the idea is to try to profit from economic conditions. TAN could be a great addition to holdings to get exposure from a sector that has already experienced a meaningful pullback; brought on partially by the buy the rumor, sell the fact type of trading action that we saw in TAN from November 2020 (US presidential election) and January 2021 (inauguration).
Based on the technicals that we have covered above and the pullback/consolidation that we have seen in the medium-term in TAN , this seems like a potentially solid entry point area.
For additional details on the US Solar Market, the SEIA (Solar Energy Industries Association) just released their Q2 2021 report. You can view it here . It contains numerous datasets, charts, and other data, including projected residential and commercial installation projections.
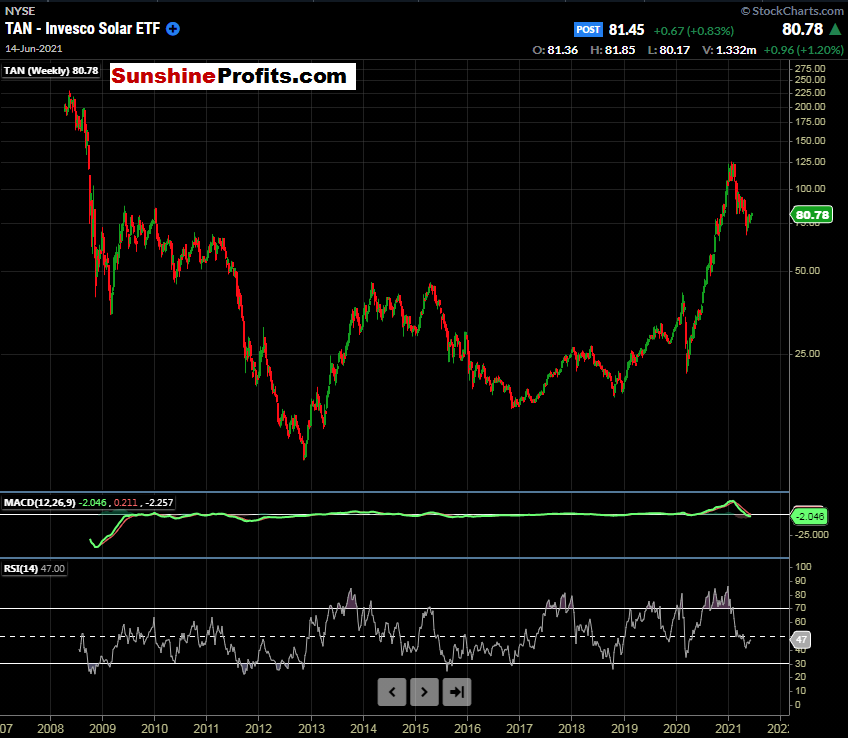
Figure 3 - Invesco Solar ETF (TAN) April 14, 2008 - June 14, 2021, Weekly Candles Source stockcharts.com
Let’s also take note that TAN has traded at these levels before. It traded north of $220 back in the Summer of 2008. Hint, hint: there was $4 per gallon retail gasoline in the US at that time. I think it is wise to know the long-term trading history of instruments that are covered.
What could TAN do if additional solar subsidies are issued by the Biden administration and residential + commercial installations increase? Time will tell.
Now, for our premium subscribers, let's look to pinpoint potential entry levels in TAN , and recap the eight other markets that we are covering. Not a Premium subscriber yet? Go Premium and receive my Stock Trading Alerts that include the full analysis and key price levels.
Related: Inflation and SPX Record Highs. PPI, FOMC Meeting in Focus
The views and opinions expressed in this article are those of the contributor, and do not represent the views of IRIS Media Works and Advisorpedia. Readers should not consider statements made by the contributor as formal recommendations and should consult their financial advisor before making any investment decisions. To read our full disclosure, please click here.