
Trending

Written by Christopher Gannatti
Key Takeaways
- As equities stumbled in Q1 2025, gold surged to new highs, reinforcing its role as a powerful diversifier amid shifting geopolitical and macroeconomic forces.
- Historical data shows that gold has often outperformed during extreme equity market moves, yet it’s the WisdomTree Efficient Gold Plus Equity Strategy Fund’s (GDE) unique pairing of gold futures with U.S. equities that has delivered favorable results.
- GDE was the top-performing fund in its peer group over the past one- and three-year periods, showing the strategic value of combining gold and equities in one solution.
The U.S. equity market delivered a surprisingly strong performance in 2024, with the S&P 500 Index finishing the year up 25%, defying recession fears, geopolitical uncertainty and the highest interest rates in over two decades. But as we stepped into Q1 2025, the tempo changed. The momentum that defined late 2024 didn't carry forward cleanly. Volatility returned, leadership rotated and investors were reminded that "past performance" doesn't chart the path ahead.
Notably, March 31, 2025, was the end of the quarter before the recent market swings catalyzed by the Trump Administration's evolving tariff announcements and policies. If anything, the market's up-and-down swings have increased further in magnitude after the April 2 "Liberation Day."
Meanwhile, gold, often dismissed as a relic in an era of digital innovation, quietly—and then loudly—reasserted its relevance. After notching all-time highs in 2024, it surged again in Q1 2025, reaching new records of nearly $3,170 per troy ounce.1 Far from just a crisis hedge, gold became a mirror to deep structural currents—real rates, currency skepticism and global demand shifts.
After Liberation Day, gold has largely held levels about $3,000 per troy ounce.2
The Most Recent 10 Years
First, we compare the price of gold and the S&P 500 Index on a return basis over the past 10 years. In figure 1:
- Gold's price dropped in 2015, 2018 and 2021. These were not the strongest equity market years by and large, as the S&P 500 Index was down in 2018, slightly positive in 2015 and up 28.7% in 2021.
- Gold's price appreciated more than 10% in 2017, 2019, 2020, 2023, 2024 and in the first quarter of 2025. Most of these years were strong on the equity side, but the first quarter of 2025 is signaling a divergence. Equities were down and gold was up more than 19%, but the markets have been trying to digest an ever-changing tariff backdrop from the Trump Administration during this time. So far in April 2025, this narrative has held true.
Figure 1: The Most Recent Years—Contrasting the Ups and Downs of Gold and U.S. Equities
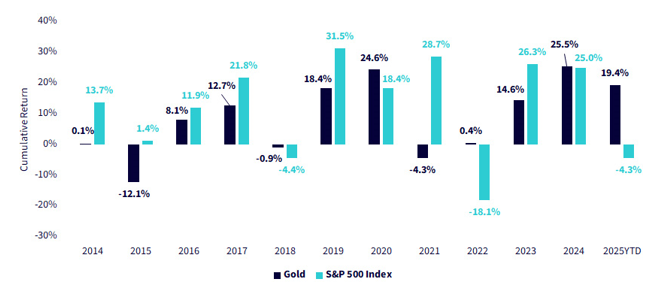
Source: Bloomberg. Gold price is measured by the LBMA Gold Price PM Index. 2025 YTD measures 12/31/24–3/31/25 performance. Past performance is not indicative of future results. You cannot invest directly in an index.
The Longer-Term Trends
On a longer-term basis, we looked back to 1967 using quarterly rather than yearly data. One of the reasons for this is evident if you go back for a moment to figure 1 and look at 2020.
- The yearly return for gold and equities in 2020 were both quite strong.
- Using annual data, it is possible to forget how governments essentially shut down the global economy, putting many financial markets in free fall during the first quarter of 2020. While there was a subsequent recovery, we can see more extremes in the quarterly data as opposed to the smoother calendar year data.
In figure 2, we pulled out the 20 worst quarters of returns for the S&P 500 Index, going back to December 29, 1967.
- Out of the 20 periods, five were associated with a negative return in the price of gold and 15 were associated with a positive return. The third quarter of 1975 was the worst, with gold actually down further than the S&P 500 Index. This was not, however, the usual case.
Figure 2: The 20 Worst Quarters of S&P 500 Index Performance from 1967
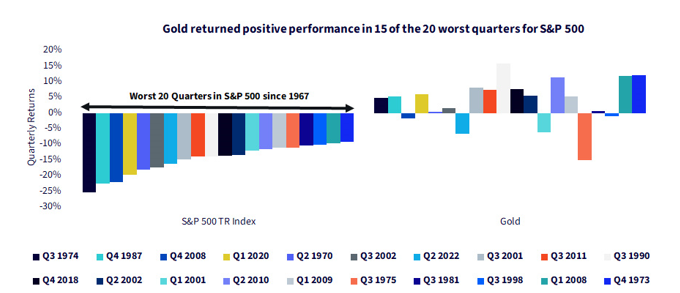
Sources: WisdomTree, Bloomberg. In USD. From 12/31/1967 to 3/31/2025, using quarterly data. Gold is measured by the LBMA Gold Price PM Index and S&P 500 is measured by the S&P 500 Gross Total Return Index. Past performance is not indicative of future results. You cannot invest directly in an index.
In figure 3, we flipped the script and looked at the 20 best quarters of returns for the S&P 500 Index over the same time frame.
- Out of the 20 periods, seven were associated with a negative return on the price of gold. The second quarter of 1980 was the most unusual, in that it showed gold up more than 30% in a three-month period.
Figure 3: The 20 Best Quarters of S&P 500 Index Performance from 1967
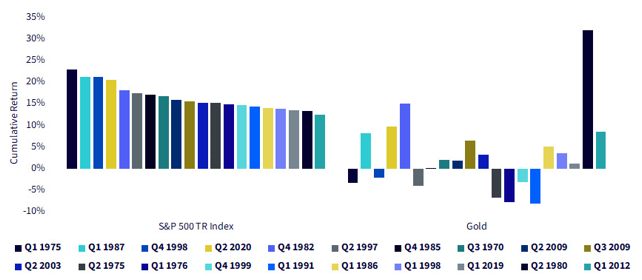
Sources: WisdomTree, Bloomberg. In USD. From 12/31/1967 to 3/31/2025, using quarterly data. Gold is measured by the LBMA Gold Price PM Index and S&P 500 is measured by the S&P 500 Gross Total Return Index. Past performance is not indicative of future results. You cannot invest directly in an index.
As a bottom line, gold is not "always up" or "always down" or "always a good hedge" for various equity market scenarios. The historical track record is mixed.
Monthly Data
We also showcase characteristics of the monthly returns. In figure 4, we break out the historical record into four groupings based on the returns of the S&P 500 Index.
- Worse than −5.0%
- Between −5.0% and 0.0%
- Between 0.0% and 5.0%
- Above 5.0%
The two best groupings for gold were the extremes—observed either when the S&P 500 Index returned worse than −5.0% in a month or better than 5.0% in a month.
Figure 4: Monthly Data Indicated Gold Was More Interesting in Equity Market Extremes
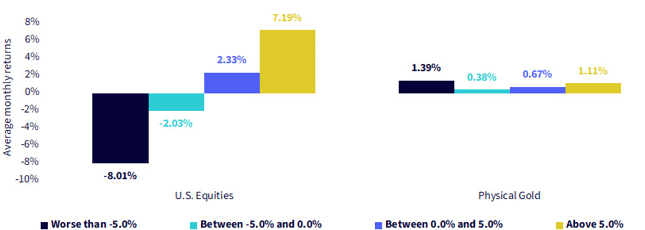
Source: Bloomberg. Gold's price is measured by the LBMA Gold Price PM Index. Data from 12/29/1967 to 3/31/25. Past performance is not indicative of future results. You cannot invest directly in an index.
The WisdomTree Efficient Gold Plus Equity Strategy Fund (GDE)
The aforementioned historical data shown in figures 1 to 4 considers gold and equities as separate asset classes—we are comparing the return of one to the return of another, given different scenarios. GDE allows us to think not of equities versus gold but rather of equities plus gold.
- The exposure is defined as 90% invested in the 500 largest U.S. equities by market capitalization, with the other 10% in short-term U.S. Treasuries as collateral for a futures position.
- The futures position is defined as a 90% notional exposure to gold futures.
- The total exposure therefore includes the impact of leverage, as 90% exposure to equities + 90% exposure to gold futures = 180% combined exposure. Put another way, every $100 dollars is exposed to $180 notionally of equities and gold futures, split equally between the two.
- Leverage has the potential to increase the volatility of an investment relative to either of the underlying asset classes viewed individually. GDE represents a long position in equities and a long position in gold futures, thereby benefitting if these asset classes are delivering positive returns.
Figure 5 depicts the standardized return picture.
Figure 5: Standardized Returns
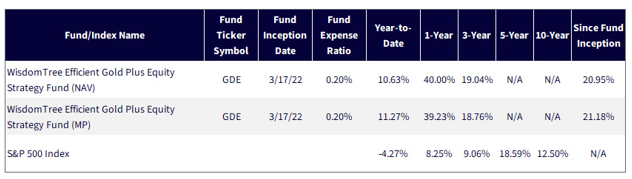
Sources: Morningstar, FactSet and WisdomTree, specifically data is from the PATH Fund Comparison Tool, accessed as of 4/9/25, but showing returns for the period ended 3/31/25. NAV denotes total return performance at net asset value. MP denotes market price performance.
Past performance is not indicative of future results. Investment return and principal value of an investment will fluctuate so that an investor's shares, when redeemed, may be worth more or less than their original cost. Current performance may be lower or higher than the performance data quoted. For the most recent month-end and standardized performance and to download the respective Fund prospectuses, click the relevant ticker: GDE.
GDE's track record has been strong when measured against the S&P 500 Index.
Figure 6: Strong Performance of GDE over its History
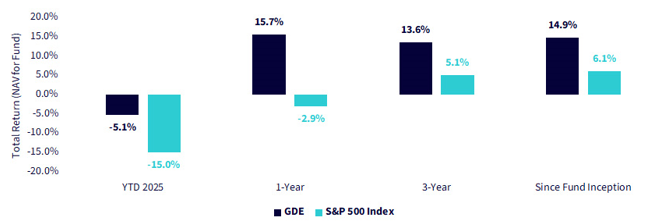
Sources: Morningstar, FactSet and WisdomTree, specifically data is from the PATH Fund Comparison Tool, accessed as of 4/9/25, but showing returns for the period ended 4/8/25. NAV denotes total return performance at net asset value. MP denotes market price performance. GDE's inception date is 3/17/22.
Past performance is not indicative of future results. Investment return and principal value of an investment will fluctuate so that an investor's shares, when redeemed, may be worth more or less than their original cost. Current performance may be lower or higher than the performance data quoted. For the most recent month-end and standardized performance and to download the respective Fund prospectuses, click the relevant ticker: GDE.
Conclusion: It Is Rare to Be #1
Morningstar places GDE within the broader U.S. Large Blend category. The leveraged exposure to gold futures is a unique proposition.
- Year-to-date 2025, GDE was the second-best performing strategy within this peer group—and this was among 1,421 strategies in total.
- Over the one-year period ended March 31, 2025, GDE was actually the TOP performing strategy in the very broad peer group—among 1,375 strategies.
- For the three-year period ended March 31, 2025, GDE was also the TOP performing strategy, in this case among 1,274 different strategies.
Adding gold futures exposure on top of traditional equities is driving these results, but we think being the literal number-one fund in any time period in such a broad category is an impressive feat.
Figure 7: Ranking within the U.S. Large Blend Category

Source: Morningstar Direct. The longest available period is 4/1/22–3/31/25, based on 4/1/22 being the closest next month start relative to GDE's inception on 3/17/22. For completeness, we show it, but it is the same period as the 3-Year in this particular case. Past performance is not indicative of future results.
The challenge with adding gold historically: what part of the asset allocation pie you would sell to create room for it?
But GDE provides a solution to keep traditional equities while adding a useful portfolio diversifier. The last year is a good case study of how this worked versus other large blend solutions. Now when you face the question, Gold or equities? GDE can help you answer: Why not both!
Related: Trump, Powell & Rates: The Post-Liberation Day Edition
1 Source: https://tradingeconomics.com/commodity/gold, as of 4/3/25.
2 Source: Brijesh Patel, "Gold Rises, Eyes Best Day since October 2023 as Tariff War Heats Up," Reuters, 4/9/25.
Important Risks Related to this Article
There are risks associated with investing, including the possible loss of principal. The Fund is actively managed and invests in U.S.-listed gold futures and U.S. equity securities. The Fund’s use of U.S.-listed gold futures contracts will give rise to leverage, magnifying gains and losses and causing the Fund to be more volatile than if it had not been leveraged. Moreover, the price movements in gold and gold futures contracts may fluctuate quickly and dramatically, and have a historically low correlation with the returns of the stock and bond markets. U.S. equity securities, such as common stocks, are subject to market, economic and business risks that may cause their prices to fluctuate. The Fund’s investment strategy will also require it to redeem shares for cash or to otherwise include cash as part of its redemption proceeds, which may cause the Fund to recognize capital gains. Please read the Fund’s prospectus for specific details regarding the Fund’s risk profile.
Past performance is not indicative of future results.
U.S. investors only: Click here to obtain a WisdomTree ETF prospectus which contains investment objectives, risks, charges, expenses, and other information; read and consider carefully before investing.
WisdomTree Funds are distributed by Foreside Fund Services, LLC, in the U.S.
This WisdomTree article is provided as part of a paid sponsorship.