
Trending

Written by: Christopher Gannatti, CFA
Key Takeaways
-
As Big Tech accelerates AI monetization, QGRW has outpaced QQQ by over 3% annualized since inception, demonstrating that fundamentals-driven exposure can beat pure size-based strategies.
-
QGRW-only holdings have delivered significantly higher forward earnings growth, EBITDA and sales compared to QQQ-only names, highlighting the value of selective stock exposure beyond the Magnificent 7.
-
With superior return on equity and assets, QGRW's quality-growth methodology offers investors a high-conviction alternative for navigating the AI-first economy, without sacrificing familiarity or performance.
If investors had any doubts that we are still living in the era of big tech, the past few months have erased them. Microsoft and Meta not only posted blockbuster results but also guided to accelerating artificial intelligence (AI) monetization across cloud, ads and productivity.1 Amazon has doubled down on custom silicon and model partnerships, signaling a determination to dominate AI infrastructure end to end.2
Meanwhile, hyperscaler capital expenditures are now projected to surpass $400 billion in 2025, a level that dwarfs the combined totals of 2023 and 2024 and underscores the scale of the arms race.3 For investors, the implication is sharper than ever: the structural engine of global growth remains anchored in the largest, most AI-leveraged firms, and the competitive moat is widening, not narrowing.
AI Moves from Infrastructure to Impact
The AI story has moved firmly into what can only be called its deployment era. The infrastructure race, building out graphics processing units (GPUs) and hyperscale data centers, remains intense, but the center of gravity has shifted to monetization and integration. Microsoft has begun to show tangible revenue lift from Copilot across Office, GitHub and Azure, while also pushing into agentic AI for enterprises.4 Amazon is threading AI through logistics, e-commerce and especially its ad business, where AI targeting has become a material growth driver. Even Apple, once perceived as behind, has rolled out on-device AI features designed to make iPhones and Macs central to everyday intelligence. These developments point to something deeper. AI is no longer a technology story; it is becoming the operating system for corporate strategy.
The Magnificent 7: Still the Gravity Well of Markets
A gravity well is a term from physics describing how massive objects warp space-time and pull others inexorably toward them, an apt metaphor for the seven companies that continue to dominate investor attention. We are getting closer and closer to the three-year anniversary of ChatGPT's release, the event that ignited its historic run.
Apple, Amazon, Alphabet, Microsoft, Meta, Nvidia and Tesla remain the lodestars of global markets, even if the individual share price performances of these firms have become more varied. Collectively, they have redefined "mega cap," commanding a disproportionate share of flows, headlines and especially market capitalization-based index weightings. These firms now sit at the nexus of nearly every frontier: agentic AI, custom silicon, vertical integration across hardware and software, and the blurring of consumer and enterprise technology. In practical terms, they are no longer just market leaders, they are the gravitational core of innovation itself.
Not All Indexes Think Alike
For many, the Nasdaq 100 Index, the total returns of which are tracked by Invesco QQQ Trust, Series 1 (QQQ), has been synonymous with exposure to big tech. But there's an important nuance hiding in plain sight: the Nasdaq 100 Index doesn't explicitly target growth or quality. It simply selects the 100 largest non-financial stocks trading on the Nasdaq exchange.5 This means that while QQQ gives investors access to scale, it does not optimize for company fundamentals. As the market begins to differentiate more sharply within the mega cap cohort, index design can become an active decision, even in passive wrappers.
QGRW: Quality Growth for the AI-First Economy
Enter the WisdomTree U.S. Quality Growth Fund (QGRW), a fundamentally driven alternative, designed to track the total return performance of the WisdomTree U.S. Quality Growth Index, which focuses toward the more profitable, higher-growth names in large-cap U.S. equities. There is a direct emphasis on return on equity, return on assets and earnings growth, as compared to Nasdaq 100 Index constituents, which are not included due to any direct requirements like this. For investors who believe the AI boom still has legs, but want a basket built on enduring fundamentals, not just market cap, QGRW may offer the right lens for this next leg of the tech trade.
Figure 1: Standardized Returns

Sources: WisdomTree, FactSet, specifically data from the Fund Comparison Tool in the PATH suite of tools, accessed 9/11/25, with returns as of 6/30/25. NAV denotes total return performance at net asset value. MP denotes market price performance. The performance data quoted represents past performance and is not indicative of future results. Investment return and principal value of an investment will fluctuate so that an investor's shares, when redeemed, may be worth more or less than their original cost. Current performance may be lower or higher than the performance data quoted. For the most recent month-end and standardized performance, click the relevant ticker: QGRW, QQQ.
Performance Is the First Filter, and QGRW Passes
Despite being a newer entrant, QGRW has delivered superior total returns relative to QQQ across nearly every timeframe shown in figure 2, such as quarter-to-date, one year and over the longest common period (since December 15, 2022, the inception of QGRW). Over this live track record, which is inexorably marching closer to three years, QGRW has outpaced QQQ by over three percentage points annualized, demonstrating that its quality-growth framework isn't just theory, it's translating into performance.
Figure 2: Outpacing the Nasdaq: QGRW vs. QQQ across Market Cycles
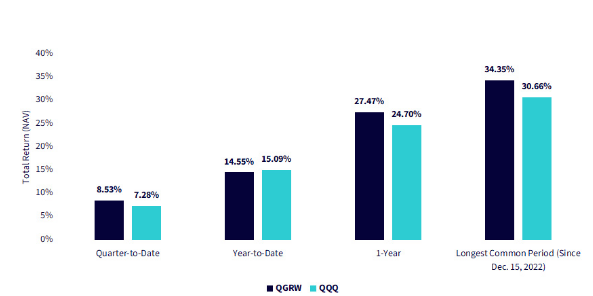
Sources: WisdomTree, FactSet, specifically data from the Fund Comparison Tool in the PATH suite of tools, accessed 9/13/25, with returns as of 9/12/25. NAV denotes total return performance at net asset value. MP denotes market price performance. Dec. 15, 2022 represents the inception of QGRW. Past performance is not indicative of future results. Investment return and principal value of an investment will fluctuate so that an investor's shares, when redeemed, may be worth more or less than their original cost. Current performance may be lower or higher than the performance data quoted. For the most recent month-end and standardized performance, click the relevant ticker: QGRW, QQQ.
Stock Selection: QGRW vs. QQQ
As we noted above, the Nasdaq 100 Index, the benchmark that QQQ is designed to track after fees and expenses, requires companies to be outside of financials and trading on the Nasdaq exchange. If the goal is to find the Magnificent 7, then this doesn't matter, as these stocks have been constituents of the Nasdaq 100 Index. If the market starts to broaden out and performance is coming from other places, this more naïve selection may start to matter more.
The following three figures focus on different ways to look at growth. The concept of growth is a central concern of many investors considering technology exposure, in that these businesses become exciting when they offer the potential of above-market rates of growth for long periods of time. Figures 3a, 3b and 3c look at:
-
Forward 3-year earnings growth estimates: This reflects the aggregated analyst forecasts for each company's expected earnings growth over the next three years.
-
5-year trailing EBITDA growth: EBITDA, which stands for earnings before interest, taxes, depreciation and amortization, is widely used because it focuses on the operational engine of a company by stripping out items that can obscure underlying performance. Depreciation and amortization are non-cash charges tied to past investment decisions, interest reflects financing choices rather than core business health, and taxes are often shaped by strategies outside the operating model. By removing these, EBITDA gives a cleaner view of how revenues translate into operational cash-like earnings. Looking at EBITDA over a trailing five-year period further strengthens the analysis, since it mitigates the risk of any single year, distorted by unusual gains, losses or macro events, dominating the picture.
-
5-year trailing sales growth: Sales sits at or near the top of a company's income statement, making it a foundational measure of business strength and growth. Because it reflects how effectively a company is either expanding its customer base or deepening its relationship with existing customers, sales can be thought of as a direct indicator of product–market fit. Looking at sales trends over a five-year period provides an additional layer of insight, since it smooths out the noise of any one exceptional year, whether driven by a short-term surge in demand, a temporary disruption or a one-off event, and instead reveals whether the company is consistently building momentum in its core market.
When we see the WisdomTree U.S. Quality Growth Index is focusing on growth, it is these measures that are being focused upon. In reviewing these figures, we are looking at weighted averages of specific groups of companies:
-
QQQ-only: These companies were included in QQQ but not included in QGRW.
-
Overlapping holdings: These companies were included in both QGRW and QQQ.
-
QQQ-full: This represents the full list of companies in QQQ.
Figure 3a highlights that QGRW-only holdings have the strongest forward three-year earnings growth estimate at 22.2%, standing out relative to all other categories. QQQ-only holdings, overlapping positions and the full portfolios of both QGRW and QQQ all cluster tightly in the 19%–19.5% range, suggesting broadly similar expectations for those groups. The narrow dispersion among these categories reinforces that the difference is not in the shared or diversified exposures, but rather in the unique allocations specific to QGRW. In short, the growth edge appears to come from the QGRW-only segment, which is driving a higher consensus outlook than the overlapping or QQQ-driven exposures.
Figure 3a: Forward 3-Year Earnings Growth Estimates

Sources: WisdomTree, FactSet, with data representing the most currently available fundamentals and weights as of 9/11/25. Subject to change.
The chart underscores a striking contrast between the QGRW-only and QQQ-only groups, with QGRW-only delivering 22.3% trailing five-year EBITDA growth versus just 8.2% for QQQ-only. This difference highlights how QGRW's unique allocations, outside of the shared large-cap growth names, have added substantial operational momentum. The overlapping holdings, dominated by the Magnificent 7, show the strongest growth at 33.4%, which naturally lifts the full results for both strategies. Still, when isolating the non-overlapping exposures, the analysis reveals that QGRW has tapped into a much stronger set of growth companies than QQQ, underscoring the importance of what sits outside the shared mega-cap core.
Figure 3b: Trailing 5-Year EBITDA Growth

Sources: WisdomTree, FactSet, with data representing the most currently available fundamentals and weights as of 9/11/25. Subject to change.
The chart again shows a wide gap between the QGRW-only and QQQ-only groups, with QGRW-only companies generating 18.3% five-year trailing sales growth compared to just 8.6% for QQQ-only. The overlapping holdings, which include the Magnificent 7, remain the standout at 24.5% and lift the overall growth rates of both indexes. QGRW's full portfolio comes through at 23.3%, well above the 19.4% result for QQQ's full set of holdings. The pattern reinforces that QGRW's distinct exposures outside the mega-cap core have contributed far more robust sales momentum than QQQ's unique positions.
Figure 3c: 5-Year Trailing Sales Growth

Sources: WisdomTree, FactSet, with data representing the most currently available fundamentals and weights as of 9/11/25. Subject to change.
Across the three perspectives, forward earnings estimates, trailing EBITDA growth and trailing sales growth, the same story emerges: QGRW-only companies have demonstrated far stronger fundamentals than QQQ-only companies. The shared core of the portfolios, anchored by the Magnificent 7, has delivered powerful growth, but that strength alone does not explain the full difference in outcomes.
What stands out is that QGRW's distinct exposures outside of this overlapping group consistently added meaningful growth, while QQQ's unique exposures contributed much less. Taken together, the analysis underscores that the composition of QGRW offers a structurally stronger growth profile than QQQ, both in forward-looking expectations and in realized business performance.
When You Focus on Quality, It Shows: QGRW vs. QQQ on Core Profitability Metrics
Return on equity and return on assets, two cornerstone measures of business efficiency and resilience, are materially higher for QGRW. This isn't coincidence; it's the direct result of a methodology that prioritizes balance sheet strength, margin efficiency and capital discipline.
Figure 4: Quality, Quantified: QGRW Delivers Stronger Fundamentals Than QQQ

Sources: WisdomTree, FactSet, with data as of 8/31/25. Subject to change.
Conclusion
At the end of the day, the first test for any strategy is performance, and QGRW passes. Since its inception in December 2022, it has outperformed QQQ across nearly every major time horizon, doing so without making big, binary bets on sectors. In a market environment where investors increasingly gravitate toward the largest, most dominant companies, QGRW leans into that reality. But rather than simply follow size, it filters for quality, looking for those companies with superior profitability, capital efficiency and earnings momentum. The result is a portfolio that looks sectorally familiar, yet behaves fundamentally better.
What stands out is how the strategy delivers results without reinventing the wheel. QGRW doesn't try to find obscure winners in forgotten corners of the market. It finds better businesses among the names investors already know, businesses with stronger balance sheets, better returns on equity and assets, and consistently faster earnings growth. For investors seeking a higher-conviction approach to large-cap growth, QGRW offers a differentiated solution that's quietly doing something rare: delivering outperformance without demanding a leap of faith.
Figure 5: Additional Information

Sources: WisdomTree, FactSet, with assets under management sourced from WisdomTree and Invesco websites, current as of 9/10/25. Subject to change. For definitions of terms in the table above, please visit the glossary.
Related: It Is Rare To Be #1 (Or #2)
1 Source: "Microsoft Profits Soar Almost 25% on Boom in Cloud Computing," Financial Times, August 2025.
2 Source: J. Eliahou Ontiveros et al., "Amazon's AI Resurgence: AWS & Anthropic's Multi-Gigawatt Trainium Expansion," SemiAnalysis, 9/3/25.
3 Source: "AI Capex to Surge in 2025 as Hyperscalers Boost Spending, Says BofA," EconoTimes, 5/12/25.
4 Source: "Microsoft Tops Quarterly Revenue Estimates on Strong Azure Demand," Reuters, 7/30/25.
5 Source: Nasdaq, Inc., "Nasdaq-100 Index methodology," https://indexes.nasdaqomx.com, 2024.
Important Risks Related to this Article
All funds are managed differently and do not react the same to economic or market events. The investment objectives, strategies, policies or restrictions of other funds may differ and more information can be found in their respective prospectuses. Therefore, we generally do not believe it is possible to make direct fund to fund comparisons in an effort to highlight the benefits of a fund versus another similarly managed fund.
For current holdings of QGRW, please click here. Holdings are subject to risk and change.
QGRW: There are risks associated with investing, including the possible loss of principal. Growth stocks, as a group, may be out of favor with the market and underperform value stocks or the overall equity market. Growth stocks are generally more sensitive to market movements than other types of stocks. The Fund is non-diversified; as a result, changes in the market value of a single security could cause greater fluctuations in the value of Fund shares than would occur in a diversified fund. The Fund invests in the securities included in, or representative of, its index regardless of their investment merit. The Fund does not attempt to outperform its Index or take defensive positions in declining markets, and the Index may not performa as intended. Please read the Fund's prospectus for specific details regarding the Fund's risk profile.
QQQ: There are risks involved with investing in ETFs, including possible loss of money. Shares are not actively managed and are subject to risks similar to those of stocks, including those regarding short selling and margin maintenance requirements. Ordinary brokerage commissions apply. The Fund's return may not match the return of the Underlying INdex. The Fund is subject to certain other risks. Please see the current prospectus for more information regarding the risk associated with an investment in the Fund. Investments focused in a particular sector, such as technology, are subject to greater risk, and are more greatly impacted by market volatility, than more diversified investments.
Past performance is not indicative of future results.
U.S. investors only: Click here to obtain a WisdomTree ETF prospectus which contains investment objectives, risks, charges, expenses, and other information; read and consider carefully before investing.
WisdomTree Funds are distributed by Foreside Fund Services, LLC, in the U.S.
This WisdomTree article is provided as part of a paid sponsorship.