
Trending

The benefits of tax deferral
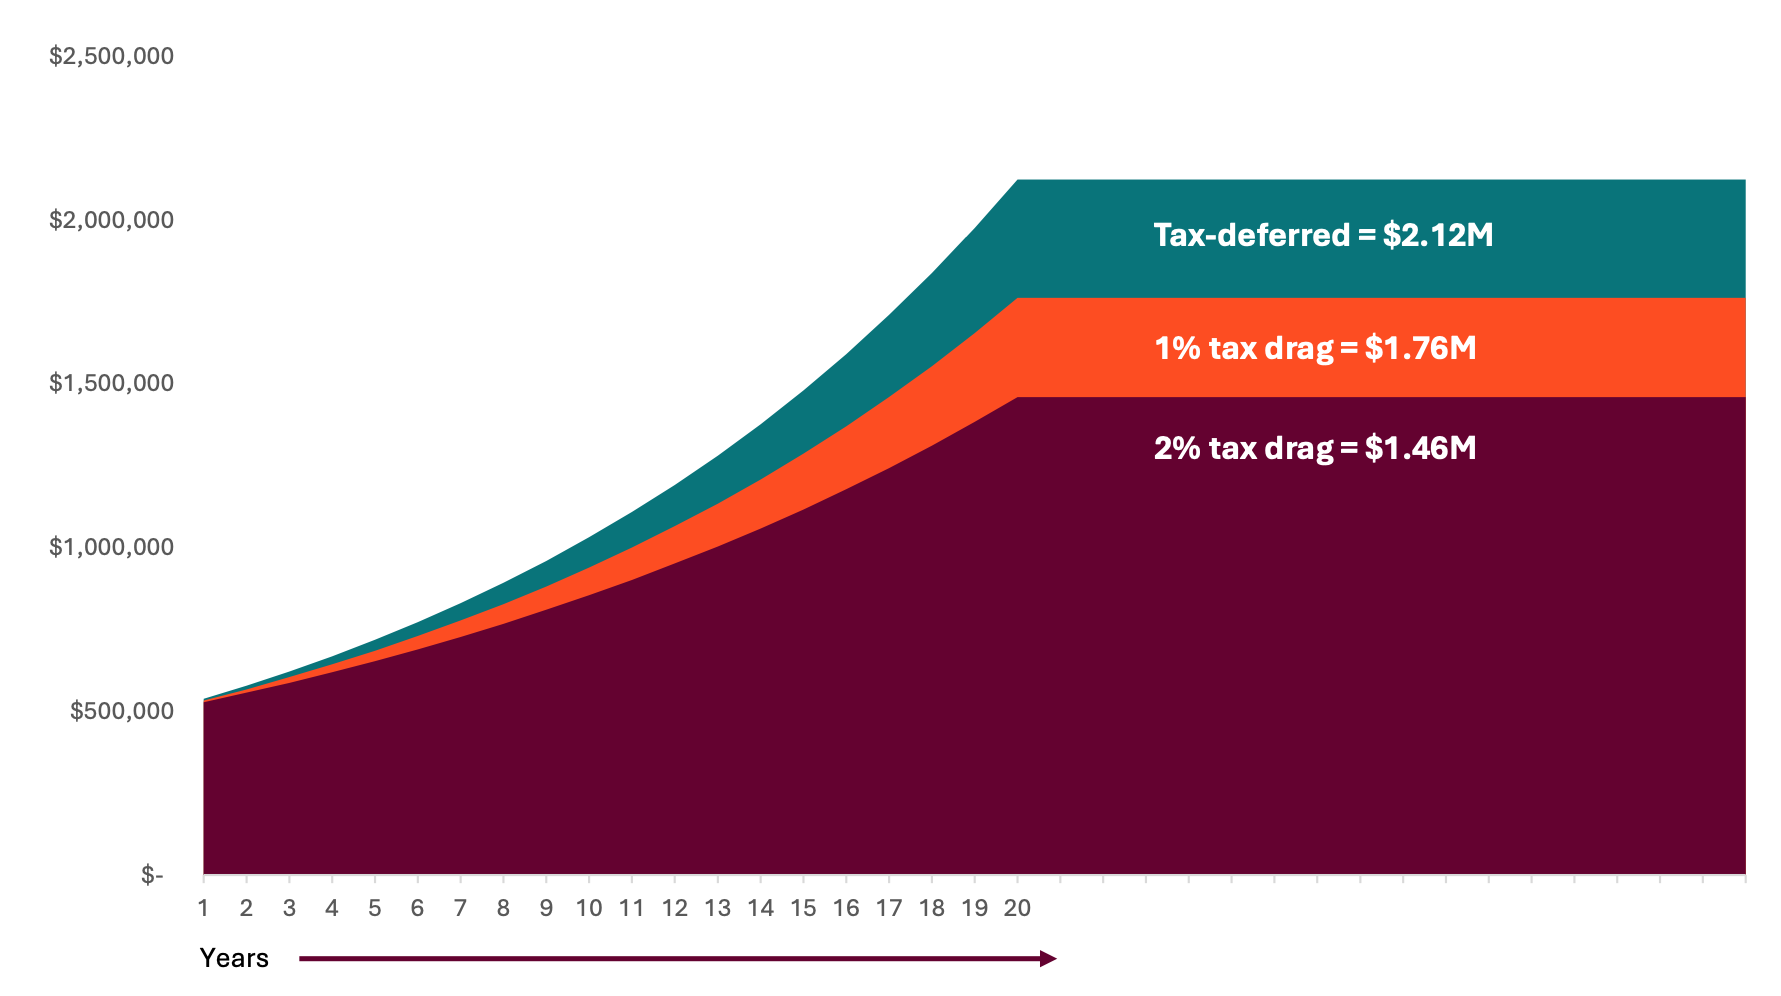
Hypothetical growth of $500,000 over 20 years at 7.5% per year, with 0%, 1% and 2% tax drag scenarios.
What this chart shows:
This chart shows a hypothetical example of the financial impact that taxes can have on a portfolio over a long-time horizon.
Why it matters:
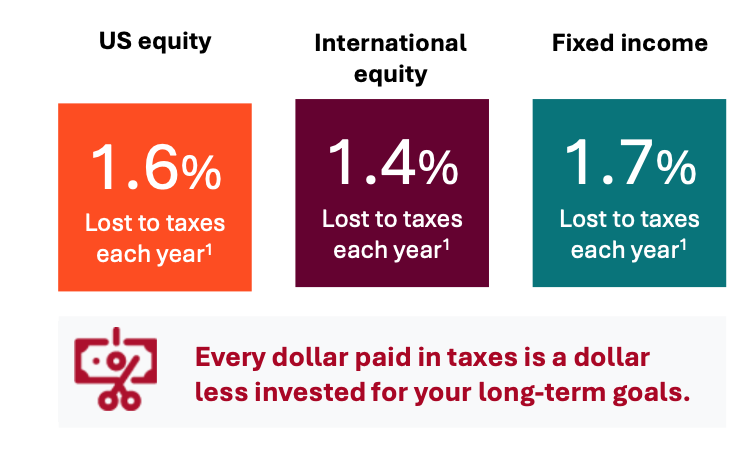
Taxes can have a meaningful impact on the long-term growth of portfolios. Because of this, investors often benefit from considering strategies designed to improve their after-tax returns.
Note: This illustration is for hypothetical purposes only and may not represent an actual experience. Tax drag represents the reduction in portfolio returns due to taxes paid on distributions (stock dividends, bond dividends and capital gains). 1Average 5yr tax cost ratio as of 3/31/26 for U.S. funds within the Morningstar categories of U.S. equity, international equity, and taxable bond. Source: Morningstar. Assumes that distributions are taxed at the highest federal tax-rate prevailing for each type of distribution, and the appropriate current or historical federal tax rate is applied to each distribution date. State and local taxes are ignored, as are the effects of AMT, exemptions, phase-out credits, or any individual specific issues.
Related: The Diversification Advantage Investors Counted On Is Changing