
Trending

The stock-bond correlation has shifted
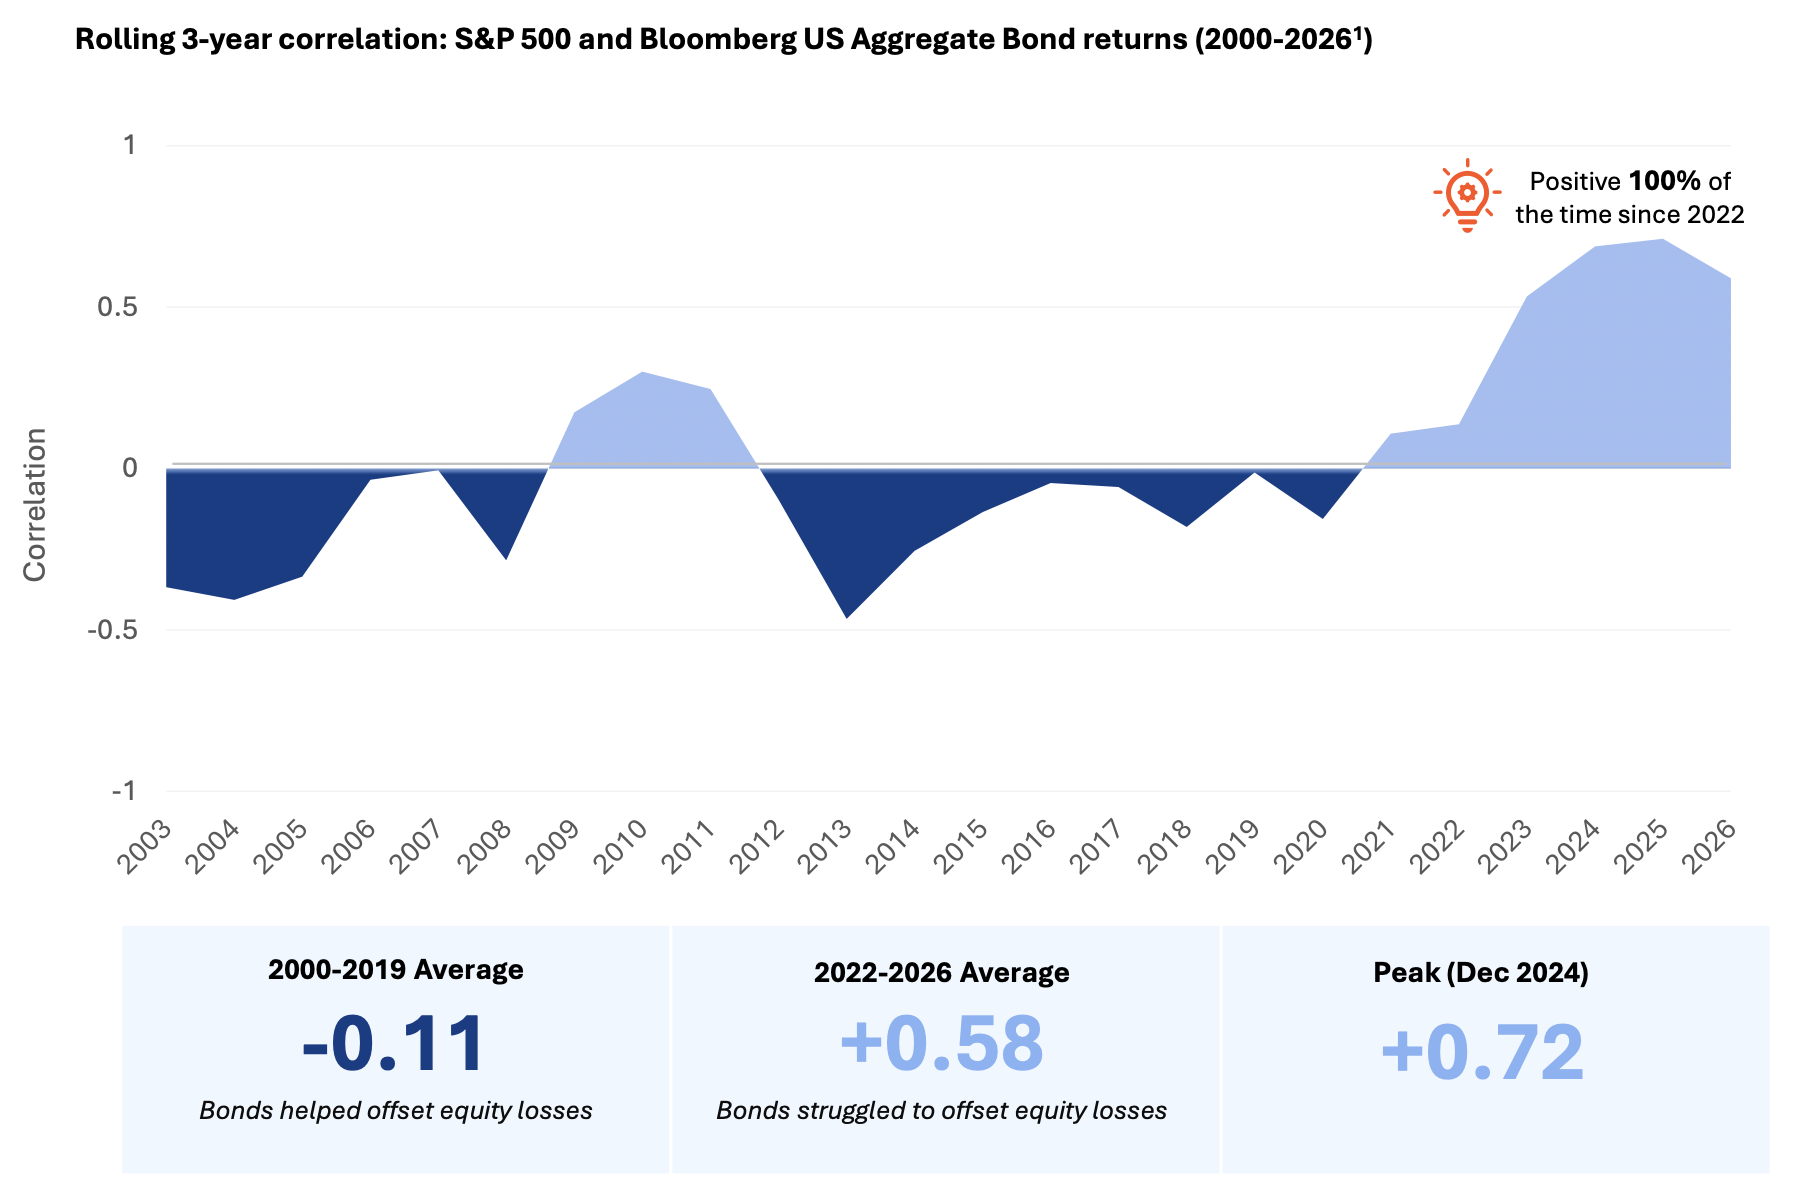
What this chart shows:
This chart tracks the 3-year rolling correlation between monthly stock and bond returns since 2000.
Through 2021, the correlation was largely negative, meaning bonds tended to rise when stocks fell, providing a natural cushion in diversified portfolios.
Since 2022, that relationship has shifted. Stocks and bonds have been moving in the same direction more consistently than prior cycles.
Why it matters:
Historically, the negative correlation between stocks and bonds was a key structural support for balanced portfolios, working quietly in the background during periods of market stress.
Since 2022, that correlation has been positive, peaking at +0.72 in late 2024. Whether this is a temporary regime or a more lasting shift remains to be seen, but it's worth asking whether portfolios have the diversification they appear to have on paper.
Moving forward, broadening sources of diversification and downside protection may help portfolios remain resilient across a wider range of market environments.
Source: Morningstar, analysis by Lincoln Financial. S&P 500 and Bloomberg U.S. Aggregate Bond Index. Analysis spans Jan 2000 – Mar 2026 using monthly returns. First 3-year period measured ended in 2003. Past performance does not guarantee or predict future returns. You cannot invest directly in an index. 1- as of 3/31/26.
Related: The End of the Magnificent 7 Trade? Market Leadership May Be Rotating