
What is this chart showing?
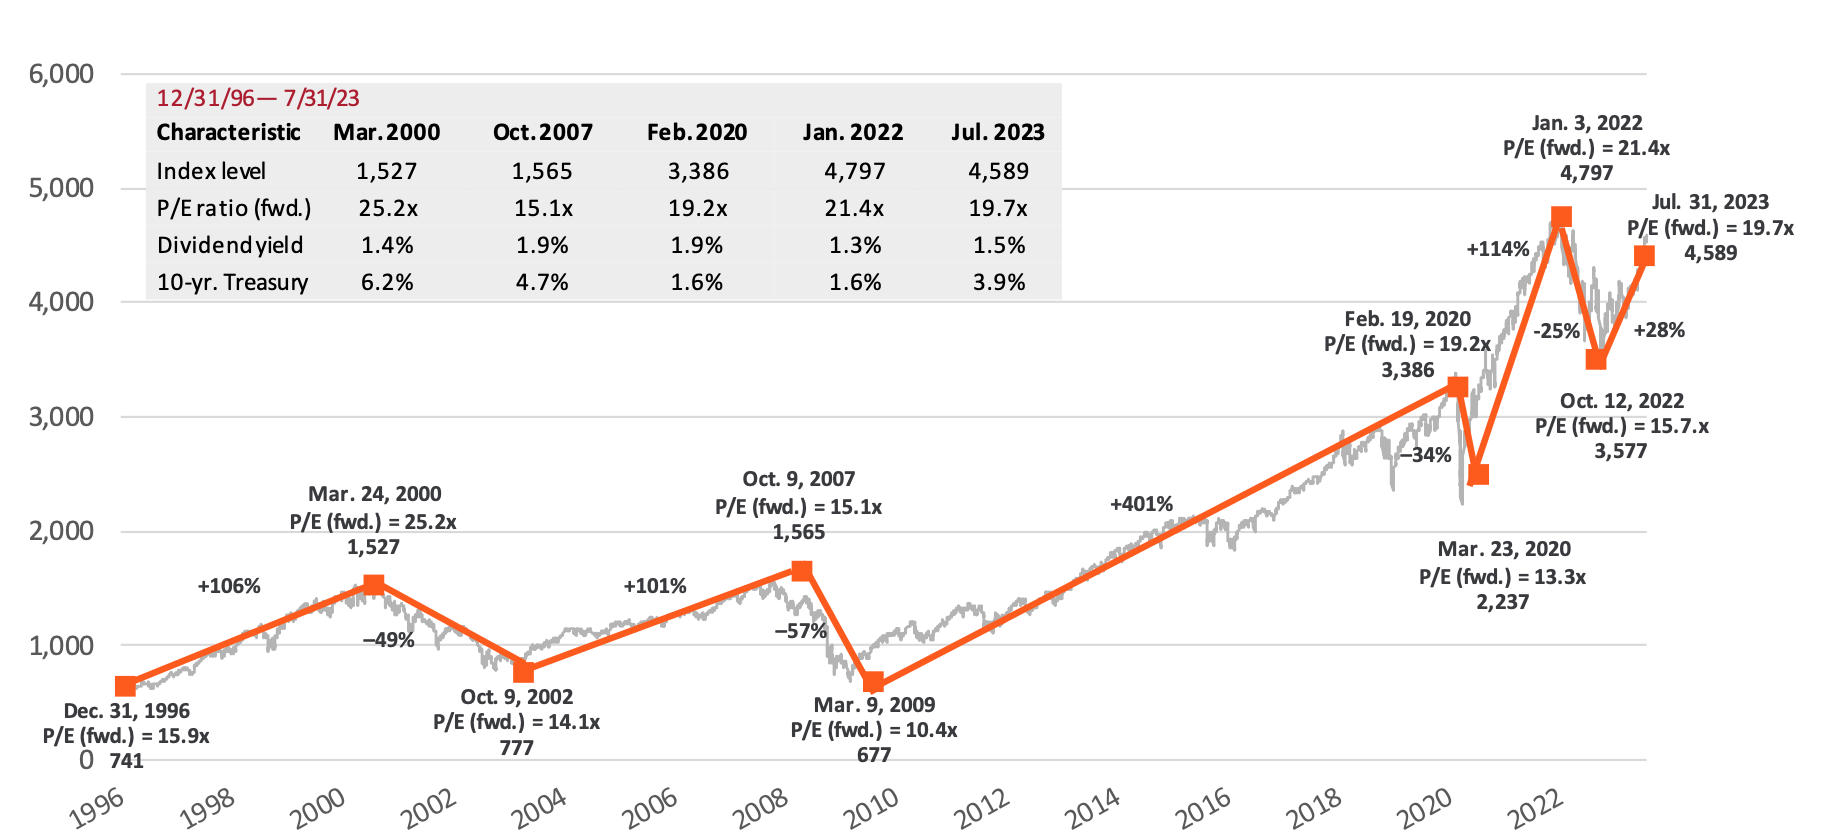
This chart shows the cumulative return of the S&P 500 Index from 1996 to present. It also highlights the return of major expansionary and contraction periods during this time.
Why is this important?
This chart can help put market cycles in context by comparing the magnitude and duration of bull and bear markets, along with the long-term trend of the S&P 500.
Past performance is not indicative of future returns. You cannot invest directly in an index. All indices are unmanaged and do not include fees or expenses. Please see the back of this presentation for index definitions and disclosures.
Source: FactSet, Standard & Poor’s, J.P. Morgan Asset Management. Data as of July 31, 2023. Dividend yield is calculated as consensus estimates of dividends for the next 12 months, divided by most recent price, as provided by Compustat. Forward price-to-earnings ratio is a bottom-up calculation based on the most recent S&P 500 Index price, divided by consensus estimates for earnings in the next 12 months (NTM). The S&P 500® Price Return Index tracks the stock performance of 500 large U.S. companies. The index used is a price index and does not reflect dividends paid on the underlying stocks.