
Trending

Infatuated with gold? Many people are, but love affairs with commodities (or stocks) are dangerous. They’ll steal your heart, then dump you.
Our critics often forget that we’re focusing on the medium-term outlook in precious metals, not intraday price moves. They’ll say “Look, gold moved up today. You were wrong Radomski.” That’s nice, but where will it be one or two months from now?
While gold, silver and mining stocks’ optimism resurfaced with a vengeance last week, the trio have broken plenty of hearts since peaking in August 2020. Thus, will the current rallies end in marriage or be another mirage?
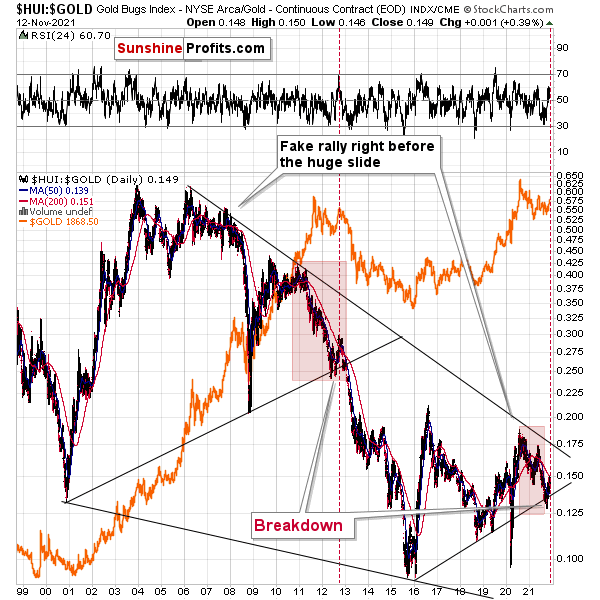
To begin, while the HUI Index/gold ratio invalidated the breakdown below its rising support line, a similar development occurred in 2013 and the downtrend still resumed.
On top of that, I marked (with the shaded red boxes below) just how similar the current price action is to 2013. And back then, after a sharp decline was followed by a small corrective upswing before the plunge, the ratio’s current behavior mirrors its historical counterpart. Furthermore, the end of the corrective upswing in 2013 occurred right before the gold price sunk to its previous lows (marked with red vertical dashed lines in the middle of the chart below). Thus, the ratio is already sending ominous warnings about the PMs’ future path.
Even more revealing, the ratio is dangerously close to its 200-day moving average. And when a similar development occurred in 2013 – with the ratio rising slightly above its 200-day moving average (marked with the red vertical dashed line below) – a sharp reversal occurred, mining stocks materially underperformed, and the ratio plunged.
Please see below:
Likewise, while the GDX ETF rallied again last week, I warned previously that a corrective upswing to $35 was a possibility (the senior miners reached this level intraday on Nov. 12). However, with the GDX ETF’s RSI (Relative Strength Index) signaling overbought conditions, the air should come out of the balloon sooner rather than later.
Please see below:
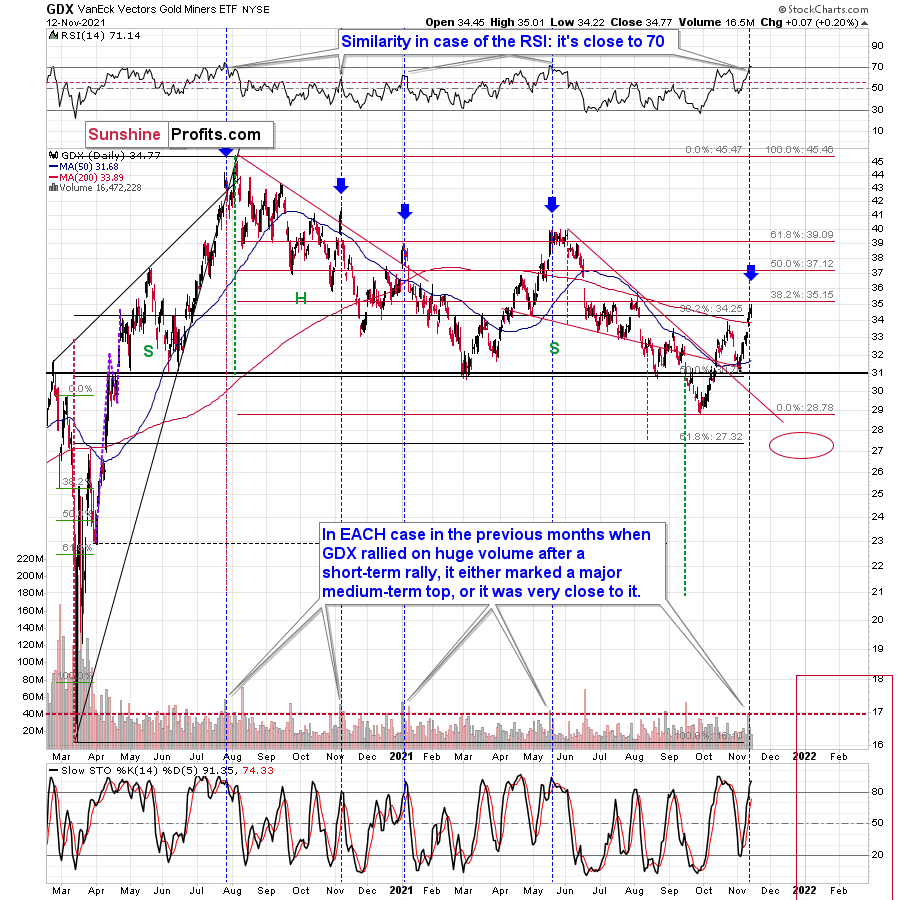
To explain, the GDX ETF rallied on huge volume on Nov. 11 and there were only 4 cases in the recent past when we saw something like that after a visible short-term rally.
In EACH of those 4 cases, GDX was after a sharp daily rally.
In EACH of those 4 cases, GDX-based RSI indicator (upper part of the chart above) was trading close to 70.
The rallies that immediately preceded these 4 cases:
- The July 27, 2020 session was immediately preceded by a 29-trading-day rally that took the GDX about 42% higher. It was 7 trading days before the final top (about 24% of time).
- The November 5, 2020 session was immediately preceded by a 5- trading -day rally that took the GDX about 14%-15% higher (the high-volume day / the top). It was 1 trading day before the final top (20% of time).
- The January 4, 2021 session was immediately preceded by a 26-trading-day rally that took the GDX about 17%-18% higher (the high-volume day / the top). It was 1 trading day before the final top (about 4% of time).
- The May 17, 2021 session was immediately preceded by a 52-trading-day rally that took the GDX about 30% higher. It was 7 trading days before the final top (about 13% of time).
So, as you can see, these sessions have even more in common than it seemed at first sight. The sessions formed soon before the final tops (4% - 24% of time of the preceding rally before the final top), but the prices didn’t move much higher compared to how much they had already rallied before the high-volume sessions.
Consequently, since the history tends to rhyme, we can expect the GDX ETF to move a bit higher here, but not significantly so, and we can expect this extra move higher to take between an additional 0 and 7 trading days (based on the Nov. 12 session, so as of Nov. 15 it’s between 0 and 6 trading days).
Why 0 – 6 trading days (as of today – Nov. 15)? Because with the 4% timeline now in the rearview, the latter represents the updated 24% timeline based on the preceding rally (that took 30 trading days).
Since it’s unlikely to take the mining stocks much higher, and the reversal could take place as soon as today (also in gold and silver price), I don’t think that making adjustments to the current short positions in the mining stocks is justified from the risk to reward point of view.
Is there a meaningful resistance level that would be likely to trigger a decline in mining stocks? Yes! The GDX ETF is just below its 38.2% Fibonacci retracement level based on the August 2020 – September 2021 decline. The resistance is slightly above $35, so that’s when the final top could form.
As for the GDXJ ETF, the gold junior miners have already hit their 38.2% Fibonacci retracement level (potential resistance) and the top may be upon us. Moreover, when the GDXJ ETF’s RSI increased above (or near) 70 in mid-2020 and in mid-2021, sharp drawdowns followed.
As a result, those historical readings provided us with great shorting opportunities.
In conclusion, investors have fallen in love with gold, silver, and mining stocks once again. However, when it comes time for matrimony, the precious metals often leave investors at the altar. As a result, while we remain bullish on gold, silver, and mining stocks’ long-term prospects, timing is important. And while the recent upswings may seem like the beginning of a new bull market, several reliable indicators beg to differ. Thus, caution is warranted, and new lows will likely materialize over the medium term.
Related: Will Evergrande Make Gold Grand?
The views and opinions expressed in this article are those of the contributor, and do not represent the views of IRIS Media Works and Advisorpedia. Readers should not consider statements made by the contributor as formal recommendations and should consult their financial advisor before making any investment decisions. To read our full disclosure, please click here.