
Trending

Written by: Przemyslaw Radomski, CFA
While the USDX rushes up without looking back, gold is running... out of power. What could the next dollar highs mean for the precious metals market?
In short, practically everything that I wrote in yesterday’s analysis remains up-to-date. Based on the relative valuations and pre-market price movement, I wrote that junior miners were likely to decline below their rising support line, and I moved the exit price for the current short position in the GDXJ lower (it seems that it will gain even more shortly).
Indeed, the GDXJ fell like a stone in the water, and it pierced through the above-mentioned support line without looking back. Thanks to remaining in the short position, we were able to benefit from the breakdown below the support line.
What’s next? Well, what was likely yesterday remains likely today. Markets appear to be approaching, but not yet at, their short-term corrections. Let’s take a closer look, starting with the USD Index.
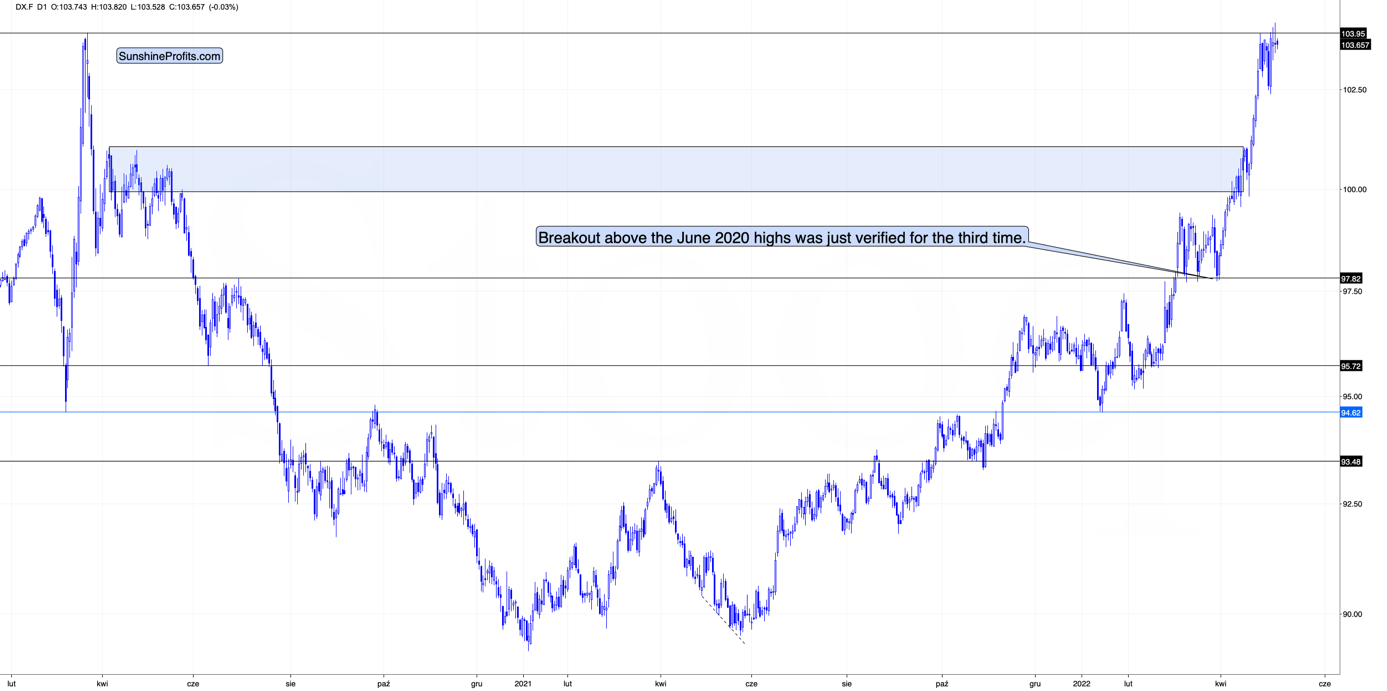
As you can see above, the USD Index just moved above its 2020 high and above its recent highs, but it failed to close in the green. Actually, the USDX declined slightly during yesterday’s session. So, while gold was initially strong relative to the USDX, it ended up being very weak. This tells us that if the USD Index moved a bit higher here, gold might launch another quick decline.
Given how the USD Index performed after a similar breakout (in 2014), it seems that we might see a corrective move soon (perhaps after an additional rally). I previously described it in the following way:
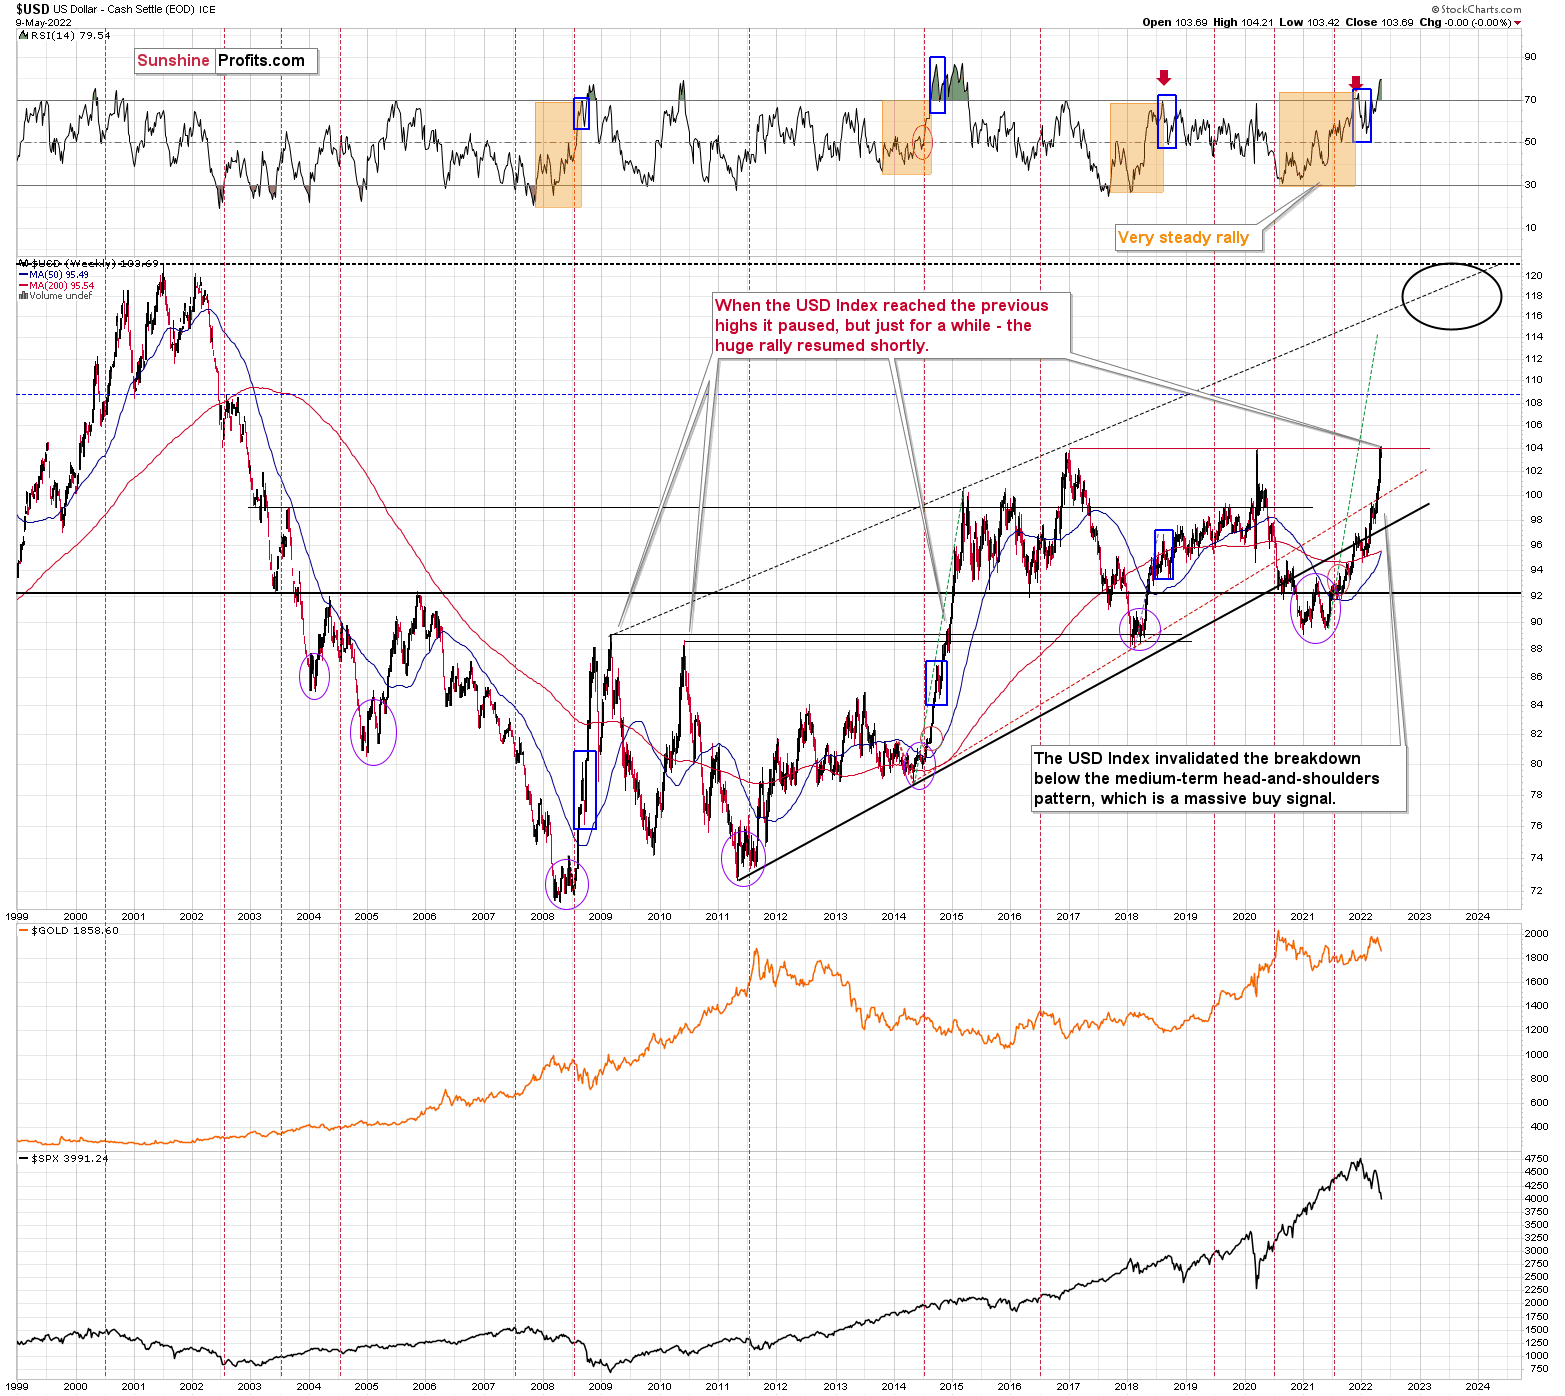
I would like to add one important detail. Back in 2014, the USD Index didn’t correct after reaching its previous high. It corrected after moving above it. The higher of the highs was the March 2009 high, at 89.11.
The higher of the recent highs is at 103.96 right now, so if the analogy to 2014 is to remain intact, the USD Index could now top at close to 104.5 or even 105.
Yesterday’s high was 104.2, so the USDX could still move higher before correcting.
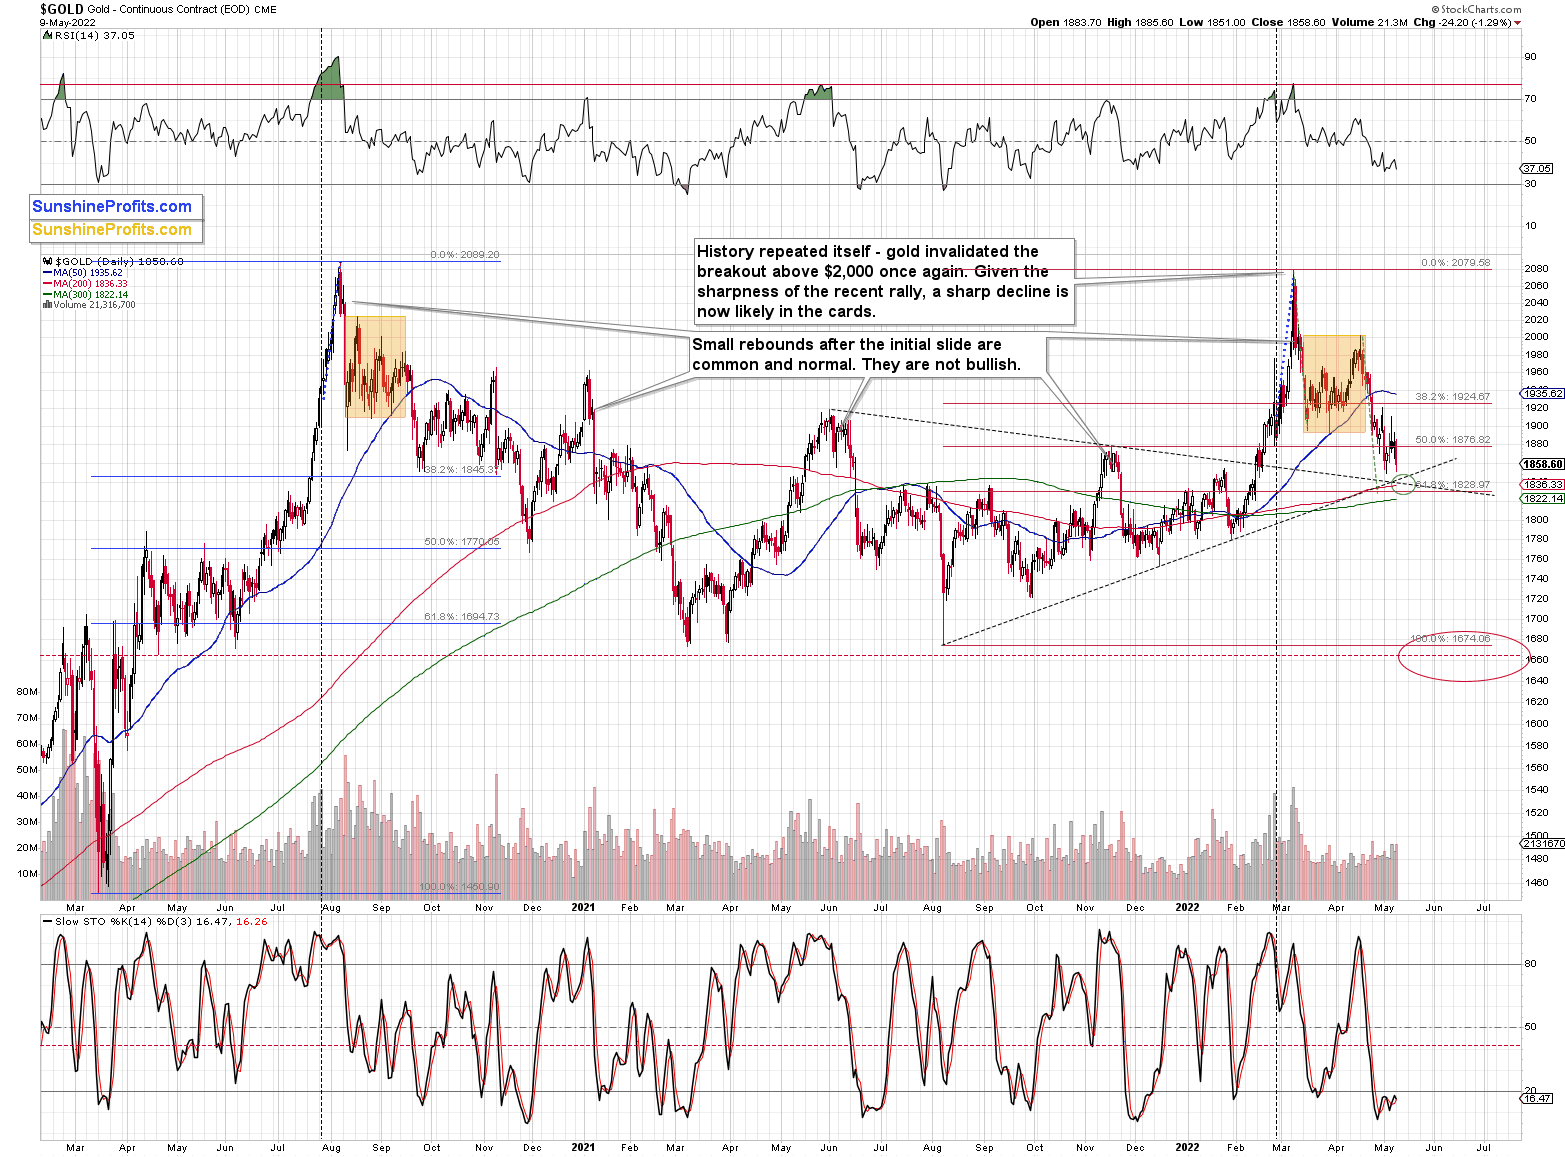
Gold moved lower – to its previous lows – but didn’t reach its downside target area (marked with green), where we have a few support levels:
- rising support line,
- declining support line,
- early-2022 high,
- the 61.8% Fibonacci retracement based on the 2021-2022 rally at about $1,829,
- 200- and 300-day moving averages (back in March 2020, gold bottomed between both averages).
Also, the RSI indicator is close to 30 but not yet at it.
Consequently, if gold declines some more here, it will have very good reasons to rally in the short term, but it doesn’t have those reasons yet.
The situation in silver is also very interesting.
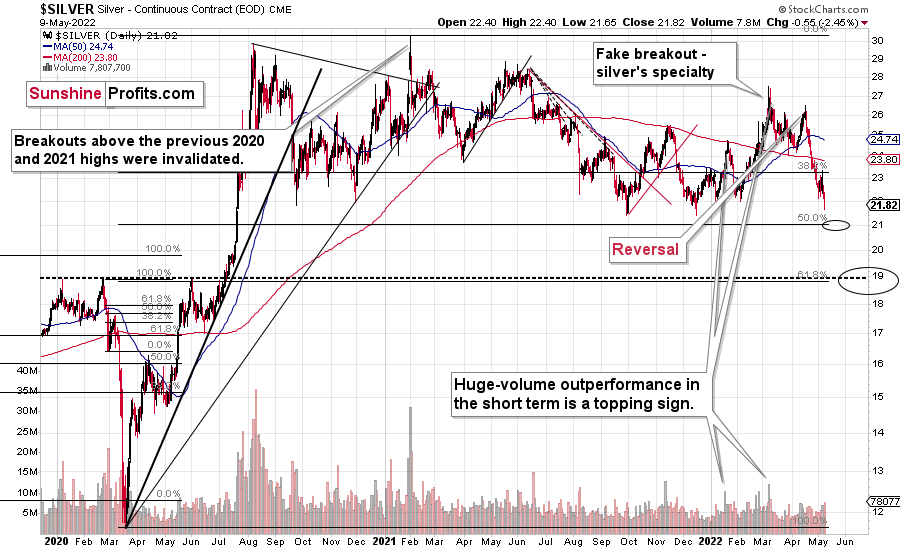
The white metal moved lower, and its intraday low was just 2 cents above our profit-take price.
Since gold is likely to move lower, and the general stock market is likely to move lower, I’m moving the downside target lower – slightly above the 50% Fibonacci retracement level based on the entire 2020-2021 decline. That’s the next strong support that’s below the 2021 lows, and that would more or less correspond to the size of the above-mentioned short-term decline in gold (at least that seems realistic to me).
It seems that mining stocks are likely to slide in the very near term too – and then they are likely to correct (probably providing an opportunity for a quick long position), quite possibly sharply.
Related: China Faces Trouble as the EU Nears Embargo on Russian Oil