
Written by: Przemyslaw Radomski, CFA
The most bearish development for gold came from… the NASDAQ. And no, these are not six typos in a row. Let me explain.
The tech stocks were the strongest part of the stock market in the previous year or so, and for a good reason. Due to the lockdown-induced surge in remote work, the need for all sorts of tech improvements (in both: software and hardware) soared. So, it’s no wonder that the NASDAQ was the strongest part of the market. It was the sole leader.
Now, there’s a rule in every market that leaders… Well, lead. This makes perfect sense, no surprise yet. But, there’s a point after which the leaders stop leading and stocks that are relatively weak or have less favorable fundamentals are catching up, eventually rallying more than the leaders. Why would this be the case? Because those who understand the markets and what’s going on are already invested, and those who are neither as knowledgeable nor experienced – the investment public – enter the market.
The investment public makes purchases often without any regard to fundamentals (or technicals) – they buy because a given asset seems cheap compared to other assets. And what would be cheap in the final part of the upswing – after the market professionals have already established their positions in well-positioned assets? The poorly positioned assets. The stocks/markets that were – for a good reason – neglected previously. So, they start buying those, and the laggards become the new leaders.
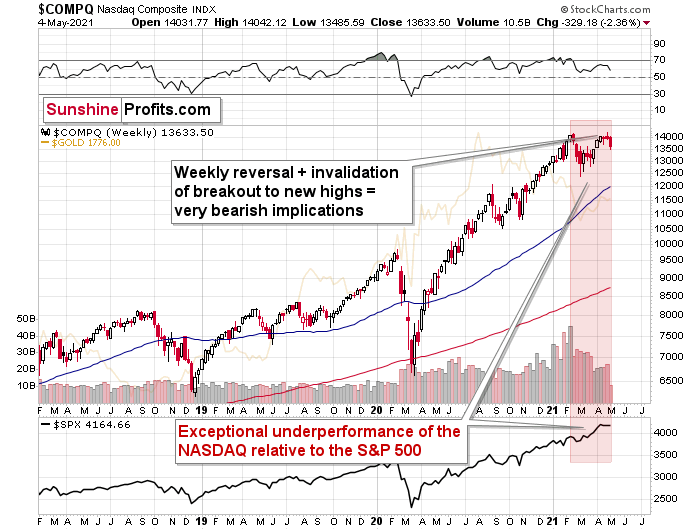
The NASDAQ was the leader that started to underperform while other stocks soared. The last few months were as clear as it gets in terms of emphasizing that. While the S&P 500 Index soared to new all-time highs, the only thing that the tech stocks managed to do was to attempt to break to new highs.
Attempt.
And fail.
Last week’s shooting-star-shaped weekly reversal was bearish on its own, but considering that it was also a failure to break to new highs, the bearish fire got gasoline poured over it.
Now, this could have been accidental, and it was prudent to wait for another decline before stating that the top in the stock market is most likely in…
Until we saw yesterday’s slide. The NASDAQ is already over 2% lower this week, and it’s only after two sessions.
Why is this important? Because if we have indeed seen a major top on the stock market , then it tells us a lot about the next moves on the precious metals market. And – in particular – about mining stocks.
The history might not repeat itself, but it does rhyme, and those who insist on ignoring it are doomed to repeat it.
And there’s practically only one situation from more than the past four decades that is similar to what we see right now.
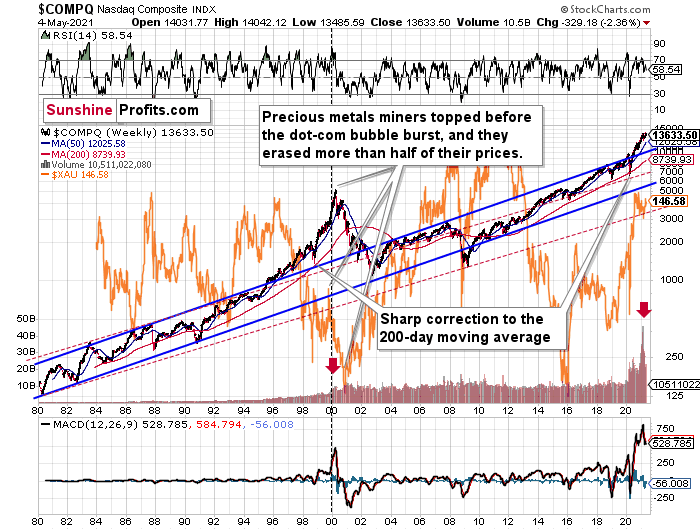
It’s the early 2000s when the tech stock bubble burst. It’s practically the only time when the tech stocks were after a similarly huge rally. It’s also the only time when the weekly MACD soared to so high levels (we already saw the critical sell signal from it). It’s also the only comparable case with regard to the breakout above the rising blue trend channel. The previous move above it was immediately followed by a pullback to the 200-week moving average, and then the final – most volatile – part of the rally started. It ended on significant volume when the MACD flashed the sell signal. Again, we’re already after this point.
The recent attempt to break to new highs that failed seems to have been the final cherry on the bearish cake.
Why should I – the precious metals investor, care?
Because of what happened in the XAU Index (a proxy for gold stocks and silver stocks ) shortly after the tech stock bubble burst last time.
What happened was that the mining stocks declined for about three months after the NASDAQ topped, and then they formed their final bottom that started the truly epic rally. And just like it was the case over 20 years ago, mining stocks topped several months before the tech stocks.
Mistaking the current situation for the true bottom is something that is likely to make a huge difference in one’s bottom line. After all, the ability to buy something about twice as cheap is practically equal to selling the same thing at twice the price. Or it’s like making money on the same epic upswing twice instead of “just” once.
And why am I writing about “half” and “twice”? Because… I’m being slightly conservative, and I assume that the history is about to rhyme once again as it very often does (despite seemingly different circumstances in the world). The XAU Index declined from its 1999 high of 92.72 to 41.61 – it erased 55.12% of its price.
The most recent medium-term high in the GDX ETF (another proxy for mining stocks) was at about $45. Half of that is $22.5, so a move to this level would be quite in tune with what we saw recently.
And the thing is that based on this week’s slide in the NASDAQ that followed the weekly reversal and the invalidation, it seems that this slide lower has already begun.
Wait, you said something about three months?
Yes, that’s approximately how long we had to wait for the final buying opportunity in the mining stocks to present itself based on the stock market top.
The reason is that after the 1929 top, gold miners declined for about three months after the general stock market started to slide. We also saw some confirmations of this theory based on the analogy to 2008.
All in all, the precious metals sector would be likely to bottom about three months after the general stock market tops. If the last week’s highs in the S&P 500 and NASDAQ were the final highs, then we might expect the precious metals sector to bottom in the middle of the year – in late July or in August.
Related: Will Biden Build Back Better … Gold?
The views and opinions expressed in this article are those of the contributor, and do not represent the views of IRIS Media Works and Advisorpedia. Readers should not consider statements made by the contributor as formal recommendations and should consult their financial advisor before making any investment decisions. To read our full disclosure, please click here.