
Written by: Przemyslaw Radomski, CFA
Last week was full of events, but the most important one clarified after Friday’s closing bell – gold formed a reversal “shooting star” candlestick.
The implications are just as you think they are. After a sharp run-up, the rally has run its course, and the yellow metal is now about to slide again.
Let’s take a closer look.
Gold Analysis
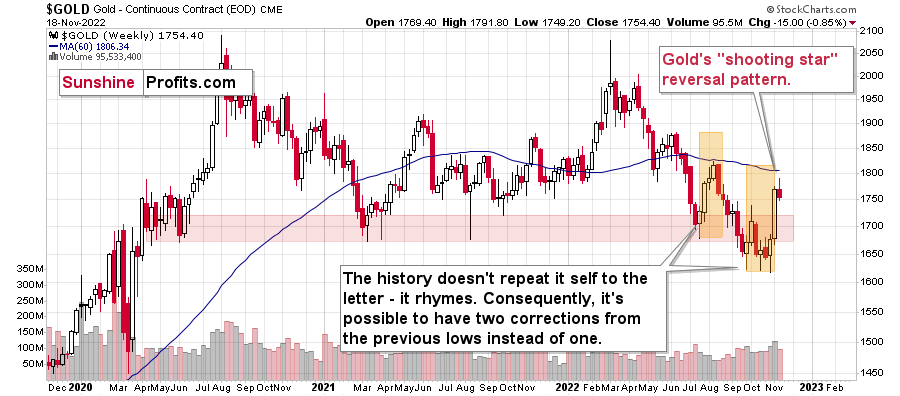
The corrective upswing was quite sizable and sharp. It was bigger than what we saw in July and August 2022, and this time, gold needed just two weeks to rally, instead of four.
Back in mid-2022, it then took gold three weeks to decline to more or less where the corrective rally started. So, yes, gold fell a bit faster than it had climbed.
History rhymes, so this time, the decline could be sharper than the rally as well. And since the rally took just two weeks… It looks like the next week or two might be very interesting for gold investors/traders. And bearish.
Actually, the next ~1.5 weeks because this week’s trading will be limited due to Thanksgiving.
You might be wondering, why I forecasted that the gold price would be about to “slide”, instead of just moving lower in a more or less regular manner.
The analogy to what gold did in 2013 is one of the major reasons.
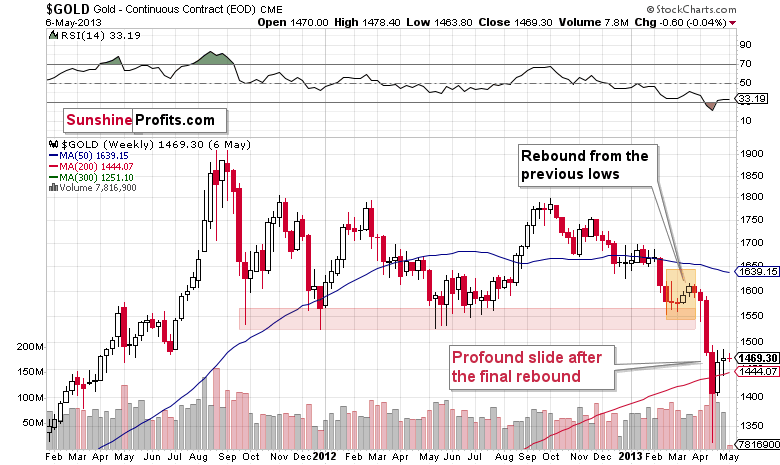
The first thing that you can notice on the above chart is that it looks just like the previous one, even though they are almost a decade apart. And that’s true.
How is that even possible, given different economic and geopolitical realities? It’s possible because the key drivers behind decisions to buy and sell remain the same: fear and greed. Those don’t change, people tend to react similarly to similar price/volume patterns.
Of course, each situation is specific, which is why history doesn’t repeat itself to the letter, but it does tend to rhyme.
When you compare the situations that I marked with orange on both charts, you’ll realize that we’re currently likely in a situation where gold is just before its major slide.
Consequently, last week’s “shooting star” candlestick is not “just” a reversal pattern. It’s a reversal pattern that likely marks the beginning of a new stage of the bigger self-similar pattern. A stage that is characterized by a dramatic downswing.
There were many other confirmations of the bearish case, but the above-mentioned link (and the one to 2008) are the most important ones, in my view. One of the remaining indications came from the silver market.
Silver Analysis
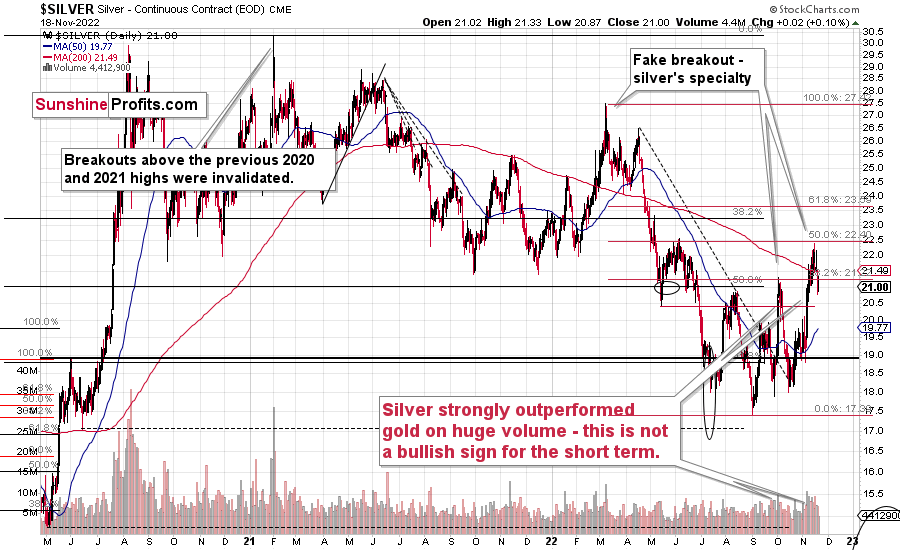
The white metal moved a lot during this recent upswing, and while most markets (stock prices, the USD Index, mining stocks) corrected ~38.2% of the preceding moves (that’s one of the classic Fibonacci retracements), silver corrected about 50% of the preceding decline.
This might appear bullish, but it’s not. Silver’s short-term outperformance of gold has proven to be a bearish indication over and over again. Consequently, forecasting higher silver prices based on the fact that it has just rallied significantly (and that it outperformed gold) is usually a bad idea.
Have We Reached the Top?
Before summarizing, I would like to recall two recent situations (one more recent than the other). Earlier this month, I received quite a few questions about the increase in the official sector’s purchases of gold – whether it was bullish. I replied that it was not bullish because the governments and monetary authorities tend to be the worst investors. They tend to buy close to the top, and they tend to sell close to the bottom.
I used the Brown Bottom as an example - the huge sale of gold reverses over 20 years ago that marked to bottom of gold prices and launched a multi-year bull market).
Interestingly, we recently saw a confirmation of this tendency – from a different market, but still. Namely, the President of El Salvador decided to make Bitcoin the country’s legal tender. That happened just a few months before Bitcoin formed its all-time high – from which it fell by over 70%.
Now, while I don’t think that gold made an all-time high recently, taking the two together makes it even more likely that gold is not about to rally in the medium term, but decline. The long-term outlook for gold remains very bullish – in my view, we just need to wait for it a bit longer (in terms of months).
Related: How Did the Rocket Explosion in Poland Affect the Oil Market?