
Trending

Written by: Steve Sonick
The trend is your friend. This adage tends to work well in a wide range of market environments. It is always tempting to seek turning points in the market, but it is far simpler to determine the underlying trend for a given financial instrument and use that as the basis for determining whether one’s bias should be to the long or short side.
Considering the recent selloffs that have occurred, it is helpful to consider whether key markets’ uptrends are still in place. During a solid uptrend, a trader should be quite willing to buy dips; during solid downtrends, a trader’s bias should be toward selling rallies. Traders and investors alike need to consider which trends are most relevant to them, and in this case, the answers differ.
There is no shortage of technical studies that attempt to define trends, the simplest and often most reliable are simple moving averages. There are two conditions to keep in mind. First, consider whether the stock or index in question is above or below the moving average. Second, consider whether the moving average is pointing up or down. If a stock is above a moving average and that average is pointing higher, that should bias a trader or investors to have a long bias. If the stock is below an average that is pointing lower, then one should bias to the short side. The difficulties occur when the conditions diverge. That is beginning to become the case with the S&P 500 Index (SPX):
SPX 6 Months Daily Candles with 30-Day (red), 100-Day (blue) and 200-Day (yellow) Moving Averages
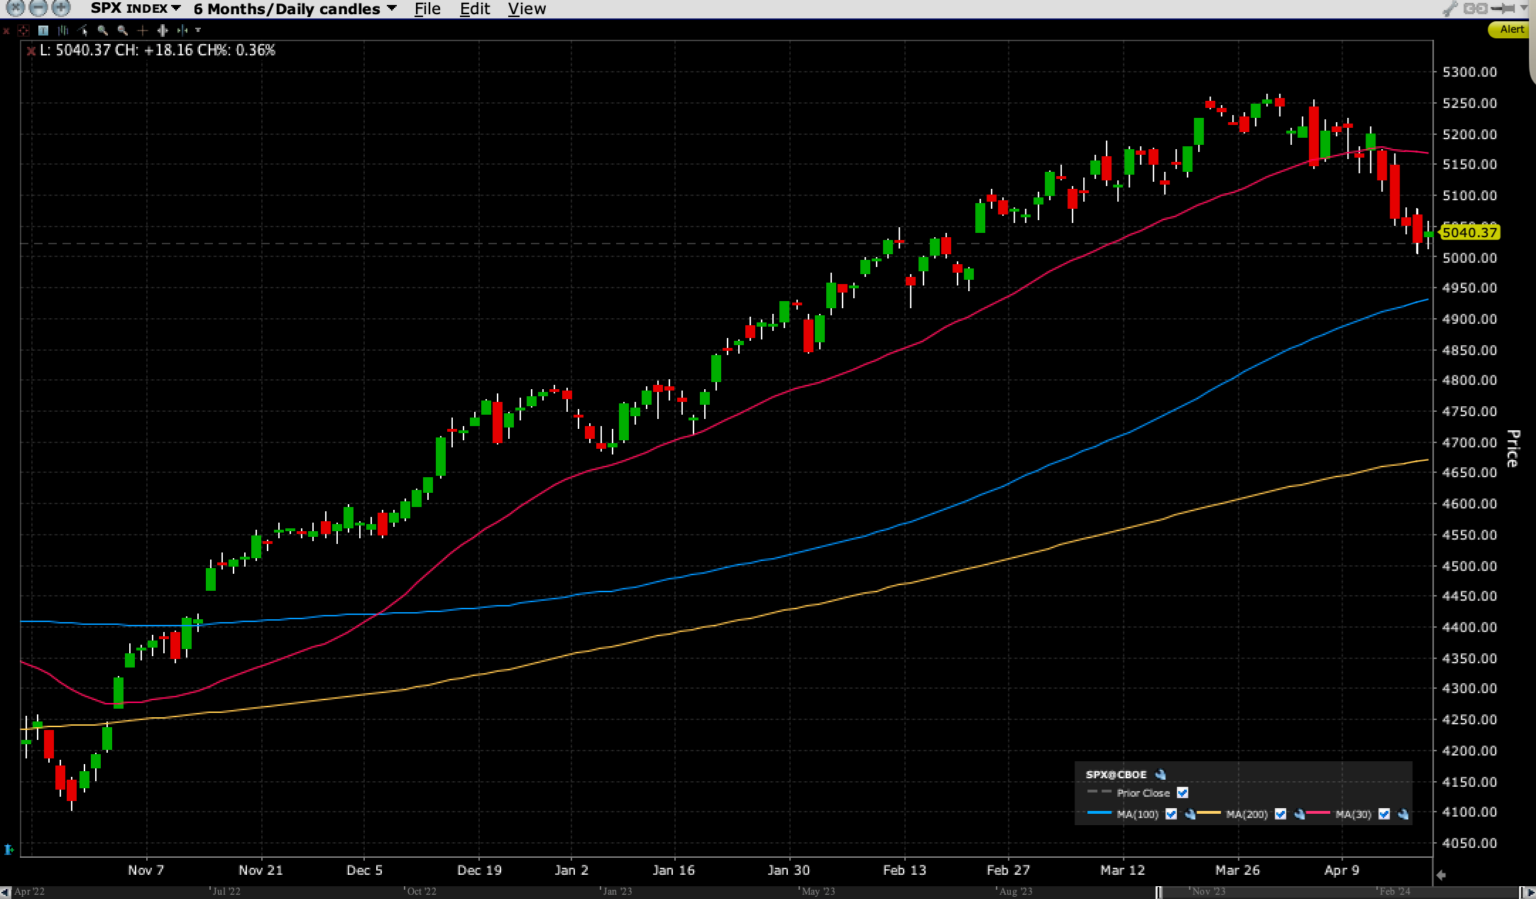
Source: Interactive Brokers
When we look carefully at the chart above, we see that SPX has not only fallen below its 30-day moving average, but that average has begun to turn lower. That’s not a great sign for the uptrend that has been firmly in place since November. That said, we still see the 100- and 200-day averages still pointing upward. It is also useful to note that the 200-day pointed upwards even as markets declined sharply last autumn, while the 100-day was flattish even after SPX began a solid rebound. Quite frankly, those facts imply that those popular long-term averages are of little use to active traders except to offer a very broad sense of the market’s trendiness.
Unfortunately, the picture is murkier when we focus on shorter-term moving averages.
SPX 6 Months Daily Candles with 10-Day (red), 30-Day (blue) and 50-Day (purple) Moving Averages
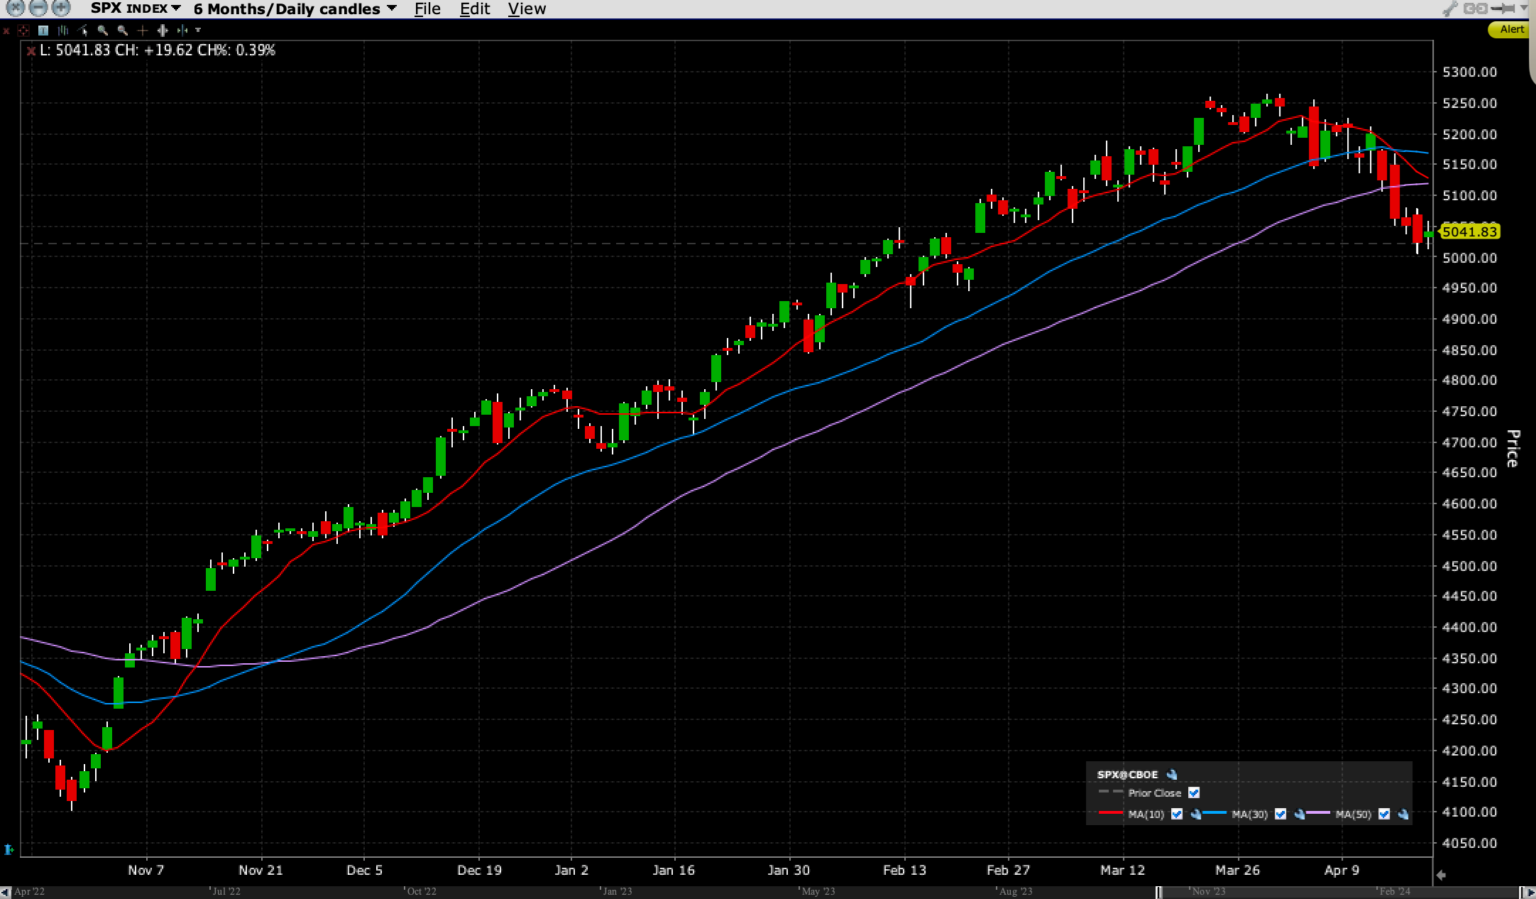
In the graph above, we see that the 10-day moving average has crossed below the 30-day moving average. This is the opposite of what occurred as the market rallied in November. We have not yet seen the 10-day cross below the 50-day, which we also saw when the rebound began in earnest, though we are certainly flirting with that occurrence.
Using the rubric mentioned above, this puts traders in an awkward position. On a short-term basis, we seem to have convincingly broken the recent uptrends. In this scenario, traders need to adjust their mentality away from reflexively buying dips, as it is quite possible that we may be in the initial stages of a market reversal. The difficulty is that for investors with longer time horizons, buy-the-dip may still be a reasonable approach.
Individuals need to think critically right now. Are you a trader or an investor? Do the moves in other markets, such as bonds and oil, favor the equity market right now? And if the answers to those questions imply that you should be selling rallies, are you comfortable trading from the short side? Not everyone is.
This is both the beauty and the curse of markets. There is often no obvious correct answer, and if there is a correct answer, it is likely to differ depending upon whomever is asking the question. Trade or invest accordingly.