
Written by: Mike Boyle | Advisor Asset Management
The U.S. economy may still be partially shutdown, but the headline spigot is still wide open with a plethora of issues dominating the media including COVID-19, equality, trade tensions and the upcoming presidential election (just 50 days away). However, the equity market headlines seem to be a bit narrower in breadth, focusing primarily on imbalances. These include imbalances at the individual security level, the sector level and the style level. Looking at the former there is concern that some COVID-19 favorite companies have moved too far too fast, and that the five biggest stocks of the S&P 500 (“Big Five”) have grown to command too big a share of the index. At the sector level there is concern that Information Technology has dominated returns for too long and again, that its share of the S&P 500 has also grown too large. Lastly, concerning style, there is a lot of brooding that growth’s dominance over value has persisted for too long. Thus, the big question, “Is this action a harbinger of a great rotation about to play out or maybe, is it just business as usual?” Let’s take a look.
The Big Five in the S&P 500 currently account for about 23% of the S&P 500, easily eclipsing the old high of about 18% at the height of the Dot Com Bubble. The consensus thesis is simple: too big to succeed. However, three of the companies that comprise the Big Five have been in that position for the last 5-20 years, and a fourth was just 5 basis points away in the 6th position. This highlights that this dominance did not occur overnight, and for a few it has been a decades-long story. In addition, remember when one of the Big Five crossed over the $1 trillion market capitalization threshold just over two years ago and the market sounded the death knell? Well, it took just two years for them to double and cross the $2 trillion mark (8/19/20). Given all of this, the Big Five are responsible for about 8% of the revenue of the S&P 500 and about 13% of the earnings. Given their current collective weight of about 23% in the S&P 500 they are clearly a bit “over their skis” based on traditional fundamental metrics. Yet, given the current global pandemic, it would be hard to argue qualitatively that these five companies aren’t well positioned to succeed both in a pandemic and post-pandemic environment and thus worthy of trading at a premium, in our opinion. The question is, “How big of a premium is warranted?”
If we look at the current sector weightings in the S&P 500, we see a similar story. Information Technology is the best performing sector over the last 15-, 10-, 5- and 1-year periods as well as year-to-date. Information Technology is also currently the largest sector at about 28% of the index, yet only responsible for about 11% of the revenue and 23% of the earnings. The current sector weight of about 28% is well above its 10-year average of about 20%, but it is also well below its Dot Com Bubble level of about 34%. Studying what occurred after the Dot Com equity market peak we see Information Technology went from the largest sector down to the 3rd largest with a weighting of about 14% by the end of 2002. Over that same period, we show Financials went from a weighting of about 13% to about 20% and attained the status as the largest sector. Interesting to note that Financials (if we include REITS [Real Estate Investment Trusts] for a correct comparison) currently sit at about 13% of the S&P 500. This is in line with their Dot Com Bubble level which shows they have clearly come full circle over the last 20 years. In a nutshell, sector weightings tend to be very cyclical and their dislocations may provide opportunities for patient and aware investors.
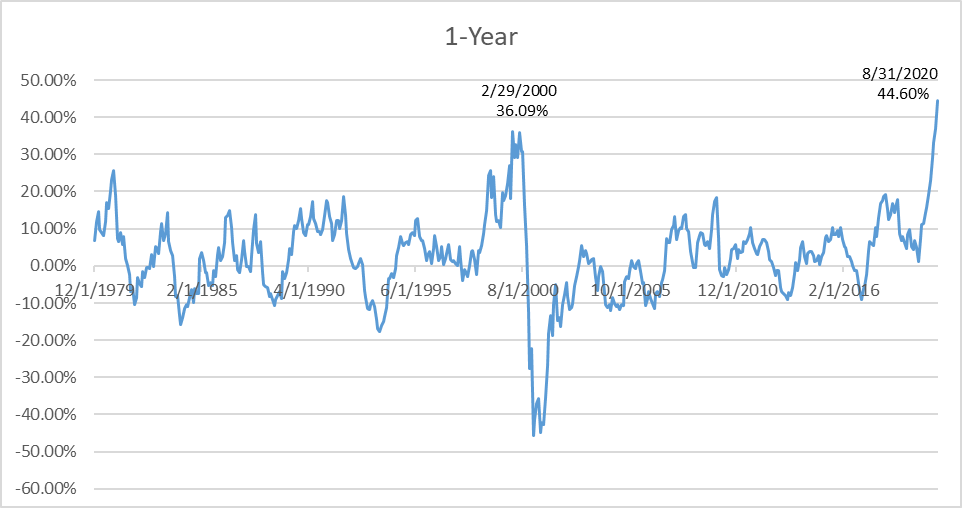
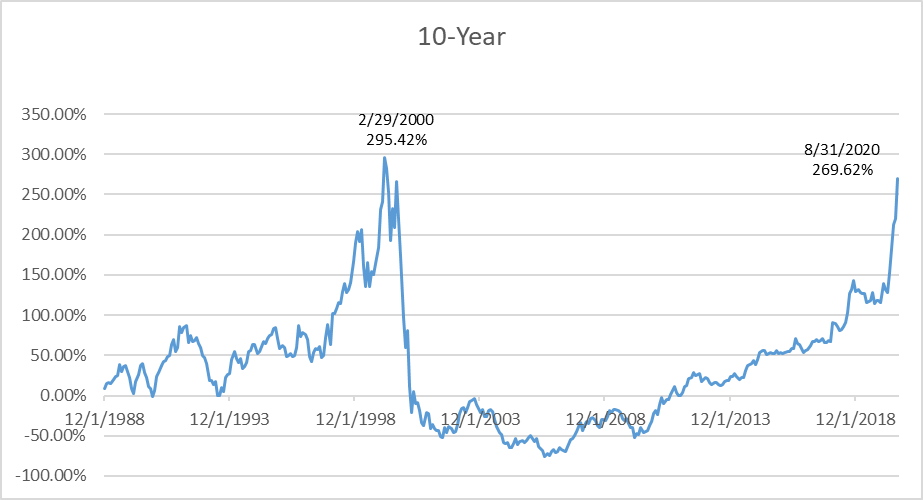
Last, but certainly not least, we are going to look at investment style, specifically, growth and value. This is perhaps the toughest of our three topics to delineate as it is very subjective and there are so many different definitions of growth and value depending on which index, asset manager or investor you reference. Tougher still because these classifications tend to evolve over time. We are going to highlight the Russell 1000 Style Indices as their history is longer than the S&P 500 Style Indices. Per Russell, they define growth stocks as firms whose share prices have higher price-to-book ratios and higher expected earnings growth rates. They define value stocks as firms whose share prices have lower price-to-book ratios and lower expected earnings growth rates. To help illustrate the performance variations between growth and value we have included two graphs that show the Russell 1000 Growth Index price return minus the Russell 1000 Value Index price return for both the trailing year (1-year) as well as the trailing 10-year periods. To clarify, anytime the line plots above the x-axis (positive value) growth is ahead.
Source: AAM, Bloomberg data | Past performance is not indicative of future results.
Source: AAM, Bloomberg data | Past performance is not indicative of future results.
As you can see the from the graphs above, in the short term, growth and value tend to follow a somewhat cyclical give and take while in the long term there tends to be longer secular trends in place. In addition, the 1-year graph clearly indicates growth currently winning and the fact that it also sits at an all-time high outperformance of 44.60% as of month end (8/31/2020). This easily outpaces its old all-time high of 36.09% set on 2/29/2000. Despite this one-year extreme imbalance the 10-year graph depicts, based on history, that there might still be some room for growth to run but the air is starting to get thin.
To try and tie all of this together, it is evident to us that on many levels the equity markets are exhibiting some significant imbalances. However, it also appears to us that for the most part there is historic precedence for this activity especially when you factor in the current global pandemic and its asymmetrical effects on the global economy. Furthermore, it is evident to us, based on history, that it is an opportune time for investors, if they haven’t already, to gain exposure to some of these under-rewarded areas of the equity markets. We believe this can be accomplished in a systematic and patient manner by adjusting weightings in increments vice large wholesale changes. One path would be to try and “think smaller” either by equally weighting some of their exposure or adding mid and small-cap stocks. As an indication that perhaps the wind is beginning to change we show the S&P 500 Equal Weight Index is outperforming the traditional S&P 500 Index (market-cap weighted) by 124 basis points (6.38% to 5.14%, 7/10/20 – 9/20/20) over the last two months indicating the mega-cap Big Five may be starting to lose some of their luster. We opened with a list of headlines including COVID-19 and the upcoming elections; clearly these two situations are going to add some uncertainty and volatility as the rest of 2020 plays out and investors need to stay patient and positive as this occurs and they attempt to rebalance their portfolios.
Related: Why Fixed Income Investors Should Pay Attention to the FOMC Policy Change